GoCharting is an online tool that provides real-time advanced charting services to crypto traders. Using the analytics and a wide variety of metrics on cryptocurrencies, GoCharting makes it possible for technical traders to make sound trading decisions.
GoCharting features one of the most inclusive and most comprehensive coverages of cryptocurrencies out there. GoCharting covers more than one hundred cryptocurrency exchanges through its platform and provides analysis on more than twenty-two thousand crypto pairs.
GoCharting’s platform provides one of the most comprehensive free tools in analysis to meet one’s trading analysis needs, it offers imbalance charts, composite and fixed volume profile, session, and best of all, it provides them free of charge and in real-time. Not only that, but the free features they offer also include over one hundred and fifty market indicators and drawing tools to balance out the usage of charts in GoCharting.
Another type of analysis that the platform provides is the automatic calculation of the market and volume profile charts, DOM charts, and price ladders. Since it utilizes an open-source language like Golang for its development and its own proprietary analysis charting tools, a user can plot one of many graphs from the data, including the spline, line, and area graphs.
| 📝 GoCharting Features | 📊 Description |
|---|---|
| 📈 Charting Analytics | GoCharting provides an extensive list of professional chart tools, including Kagi, Renko, Point and Figure, Line Break, Heiken-Ashi, Cluster Imbalance, and Range Bars. It also offers over 150 market indicators and drawing tools. |
| 🔧 User Interface | The platform has a user-friendly interface with full-screen mode, live news updates, interactive drawing, and professional charting tools. It also supports a new scripting language, G-SCRIPT, for creating technical indicators, strategies, and signals. |
| 🌐 Coverage | GoCharting covers more than 100 cryptocurrency exchanges and provides analysis on over 22,000 crypto pairs. |
| 🔒 Security | The platform is SSL certified, providing secure communication between your computer and their website. |
| 💰 Pricing | GoCharting offers a free tier with limited features. To access the full range of tools and real-time data, users need to subscribe to one of the paid plans. |
| 🔄 Transactions | The platform provides automatic calculation of the market and volume profile charts, DOM charts, and price ladders. |
| 📊 Portfolio Management | Users can build and save watchlists and portfolios on the cloud. It also provides a portfolio heatmap and multiple viewing options. |
| 📱 Mobile Compatibility | GoCharting is 100% mobile compatible, allowing users to work from mobile as well. |
| 🆚 GoCharting vs TradingView | Both platforms are powerful for traders, but they offer different features. GoCharting is unique in offering a marketplace for trading algorithms and strategies, and it provides advanced features like Market Profile, Volume Profile, and Order Flow analysis. TradingView is known for its sleek and modern-looking charts and its social media platform that allows users to interact, share opinions, and discuss market trends. |
What you'll learn 👉
Overview
GoCharting has developed a User Interface and has provided User charting Experience features that set it apart from other similar platforms. The features include:
- Full-screen mode
- EOD charting on the browser, not on archaic desktop applications
- Live news updates from leading cryptocurrency sources
- No ads
- Tick-level trade data.
- Interactive drawing and professional charting tools
- For pro-traders and programmers, a new scripting language G-SCRIPT to help create your technical indicators, strategies, and signals.
- Build and save your watchlists and portfolios on the cloud
- EOD and Intraday resolution charting
- Advanced charts, e.g., Figure, Point, and Kagi
- Customizable HTML5 charting
- Ability to share your trade analysis on Social Media
- Automatic Candlestick pattern recognition (Doji, Three Black Crows, etc.)
- 120 + technical indicators, No cap on how many indicators added to your chart
- Real-time coverage of 100plus exchanges
- Alerts on trade books and trade volumes
- All NSE stocks/indices (Cash, for now, will add FNO if demand exist)
- Multiple charts
- DOM Price Ladders: Depth of Market Price Ladders allow you to view the orderbook price level
Number of Trading Pairs
Go charting supports over 22,000 trading pairs made up of over 100 cryptocurrencies.
Integrated Exchanges
GoCharting is integrated with all the major exchanges, including:
As of the last tally, it was over 100 exchanges that are integrated with GoCharting.
Features
Check their website to see everything their offer.
Charting Analytics
- Charts – provides an extensive list of professional chart tools.
- Kagi, Renko, Point and Figure, Line Break
- Time-based graph of adjustable time intervals
- Heiken-Ashi, Cluster Imbalance, and Range Bars
- Drawings and Indicators
- Scales and Axes – offers a wide range of scaling tools to analyze complex patterns
- Linear, Log Scale, and Square Root Scale
- Inverse Scale and Dual Axes
- Lock aspect ratio to change the zoom mode
- Edge coordinators
- Cloud-Based Customization – provide a platform for customized charts; plus, a room to save charts and other templates
- Customizable Colors
- Full-Screen Mode on Browser
- Screenshot and Social Share
- Save Charts on Cloud
- Save Indicator and Drawing Templates
- Layered Charting Object
- Export Data to Excel
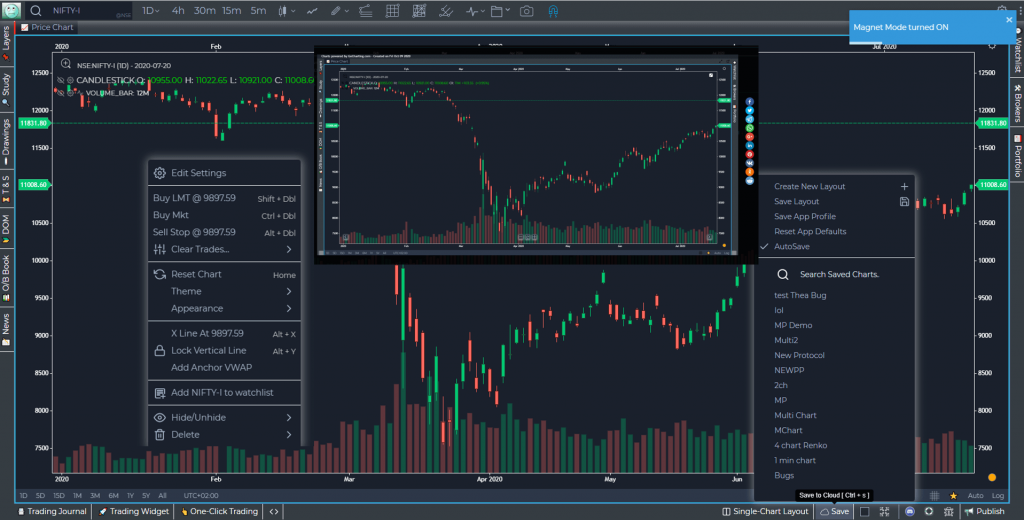
- Magnet Mode on Drawing
- Context Menus and Time Zones.
- Watchlist and Portfolio
- Footprints AKA Cluster Charts – delivers market insights using time, price, and order flow on a single chart.
- 21+ Metrics to choose from
Orderflow Charting
- Imbalance Chart – GoCharting offers a range of professional volume tools to assess the distribution of the trading volume and the imbalance between buyers and sellers.
- This Highlights the automated zones of support and resistance. The chart helps in evaluating the market behaviors. It also helps you learn the only Zero lag indicator in the world.
- Session, Composite, and Fixed Volume Profile
- Market Profile AKA TPO – To understand the price distribution during the trading session, the market portfolio/TPO is examined.
- It shows the crucial support/resistance of a particular price level.
- It also displays TPO point of control, its value area, and the single prints.
- Historical Times & Sales/ DOM/ Orderbook – use volume analysis tools directly on the order flow chart.
- Delta Bars and Cumulative Delta Bars – helps to assess divergence, if any.
- Bar Statistics and Histogram – Presenting volume statistics for each bar.
- Power Trades and Support/ Resistance Lines – display large market orders in the chart.
- VWAP, Anchor VWAP, and VWAP Bands reveal a benchmark price for assets during any period of the trading day or session.
- Chart Trading – Orders can be sent directly from the map with a single click. Order management is simple and intuitive, allowing you to adjust prices by dragging, cancel them, or execute based on the market price.
- Trading for the chart
- Hot Buttons for fast trading and managing
- Mouse trading mode with flexible settings.
- Algo decided Buy/Sell order depending on mouse position.
Order Execution
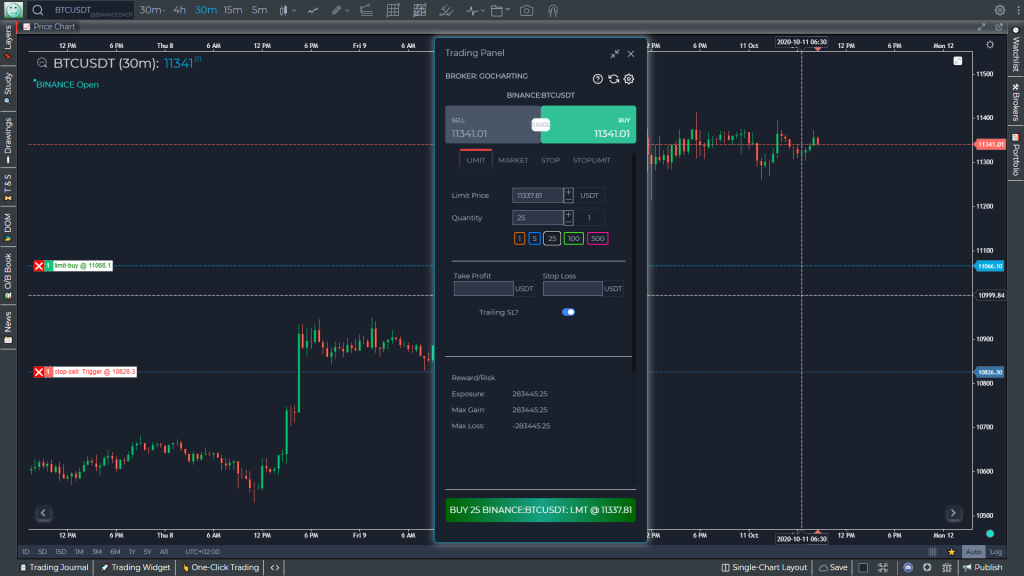
- Multiple Order Types – Execute various simple and smart order forms, which can help to reduce Risk, provide privacy, and simplify the execution process.
- Market Order
- Limit Order
- Stop Order
- TIF
- Paper and Live Trading
- The papers and live trading presents detailed trading information
- The module has hot buttons to quickly close position and cancel orders
- It also allows you grouping orders and positions for convenient management
- Custom UI – provide customers with the opportunity to create
- Every component is draggable
- Every component is resizable
- Layouts can be saved on a cloud server
Flexible Interface
- Support Multiple Monitor
- Every component can be popped out on a separate window
- Manage and interact between windows
- 100% web-based
- 100% Mobile Compatible – by using an innovative mobile browser interference, customers can work from mobile as well.
- Panel Templates
- Hot Keys, Online Demo, and Discord Support – Best-in-class Discord support, keyboard shortcuts, and an online platform demo tour
- Coloring Themes
- Technical indicators and drawing tools
- Indicator on indicator
- Channel and Moving Averages
- Oscillators and Momentums
- Volume and Order Flow
- Trends Volatility
- Candlestick Patterns
- Trends & Arrows
- Fibonacci and Gann
- Harmonic Patterns
- Text and Comments
Watchlist and portfolio
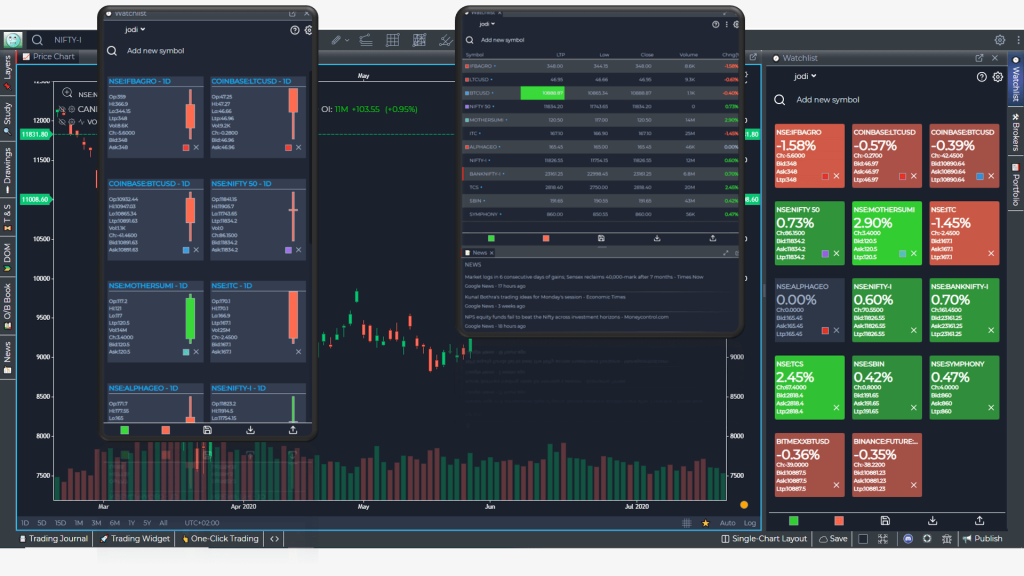
- Watchlist panels show brief pricing information on selected instruments.
- Watchlist can be added through:
- Chart Context Menu
- Chart Bottom Bar
- Watchlist symbol lookup
- Watchlist can be deleted by clicking the X symbol
- To differentiate, colors can be changed.
- Up to 5 watchlists can be created under the Free plan.
- Furthermore, under Free Profile, a user can produce up to 50 layouts; whereas, they can scale the storage up to 300 with a Premium Plan.
- Features of Watchlist and Portfolio
- Customizable watchlist
- Candle Screen
- Multiple viewing options
- Portfolio Heatmap
Pricing
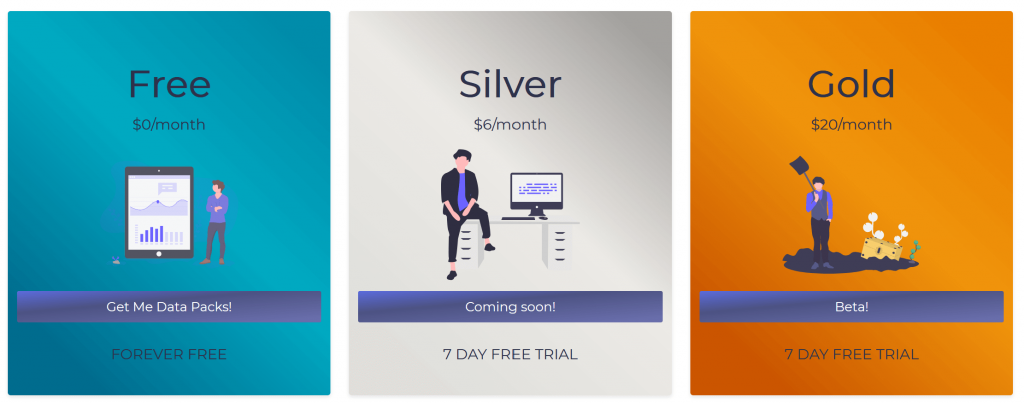
The majority of the basic features are the same for all the portfolio; however, some of the major differences are:
- Free
- Number of saved chart layouts = 50
- Number of saved indicator templates = 10
- Number of saved watchlist = 5
- Silver
- Cost = $6/month; 16.6 percent discount on annual plans
- Number of saved chart layouts = 500
- Number of saved indicator templates = 30
- Number of saved watchlist = 50
- Gold
- Cost = $20/month; 20 percent discount on annual plans
- Number of saved chart layouts = 1000
- Number of saved indicator templates = 100
- Number of saved watchlist = 500
Read also:
- Best Apps for Trading Crypto
- Best TradingView Alternatives
- Tradelize Review
- Crypto Portfolio Rebalancing Tools
- Best Cryptocurrency Portfolio Trackers
- Coinigy review
- TabTrader Review
- Trendspider Review
- TradingView vs Coinigy Review
- TradingView Review
- Coinigy vs Altrady
- Best Crypto Screeners Apps
Gocharting vs TradingView
Gocharting and TradingView are both powerful platforms for traders, but they offer different features and experiences.
Gocharting is a next-generation trading platform that offers a wide range of features for technical analysis. It’s a multi-asset, multi-currency, and multi-exchange solution with real-time data and extensive charting tools. It’s unique in offering a marketplace for trading algorithms and strategies, allowing users to buy and sell their own. Gocharting is also notable for its advanced features like Market Profile, Volume Profile, and Order Flow analysis. It offers a free tier with limited features, but to access the full range of tools and real-time data, users need to subscribe to one of the paid plans.
On the other hand, TradingView is a trading and social networking platform that aims to bring traders together to share their skills, methods, and trade ideas. It markets itself as a service for both experienced and inexperienced traders, with technical analysis, advice, and expertise making it accessible for even the more inexperienced traders.
TradingView is highly popular for its sleek and modern-looking charts, which are smooth and easy to use. It also offers a wide range of technical indicators and drawing tools. TradingView has a social media platform that allows users to interact, share opinions, and discuss market trends. It also offers different pricing tiers, starting from a free basic version to a premium plan at $59.95 per month.
Is Gocharting safe and legit?
By employing fundamental signals such as Sloan Ration, Graham Number, and Petroski number, GoCharting has its best test scoring model to evaluate property stocks.
- Risk Score model for future forecasting
- 160+ fundamental indicators, available on the scale of Quarterly, Annually, and Trailing Twelve Months (TTM) timeline mode.
- 200+ macroeconomic indicators
- The only chart that allows users to plot analyst estimates directly on the chart.
- Live news feed.
- Furthermore, it is an old website. And, the longer the website exists, it is considered to be more legit.
- The website is deemed to be popular on Alexa with a high ranking. This means that people often visit these sites; plus, they also recommend it to others, supporting its relevance.
- SSL certified- Professional companies use an SSL certificate to encrypt communication between your computer and their website.
- On the other hand, the website is hosted in a high-risk country that is India. And, countries with a high risk are the ones that the International Banking Federation identifies as having a high level of fraud and corruption.
- The website offers high financial risk services like trading oil, foreign exchanges, and off-shore investment.
As you can see from the impressive list of features, reports, charts, and execution tools listed above that GoCharting not only provides you with distinctive features but a ton of free features.
In addition, it provides for several Risk Scored models that are built for future analysis and forecasting. It provides you with over one hundred and sixty fundamental indicators from Revenue and Profit to EPS, P/E ratio. All fundamental indicators needed for forecasting and analysis are available on a Quarterly, Annual, and even Trailing Twelve Months timeline.
That is not all GoCharting covers over two hundred macroeconomic indicators, anything from Crude Oil, Gold, Rubber, GDP, and Employment. To add more, we are the only online charting platform that permits users to plot analyst estimates directly on the chart they have created. It would be best to explore how to Plot dividends, splits, bonuses, and rights on the chart.