Trendspider Review – Can You Trade On Trendspider & How To Do It?

TrendSpider is an automated market and technical analysis tool used by traders to implement the various trading strategy. The platform is used for investing, trading, and swing trading.
The tool aims to help traders spot market trends ahead of everyone else, and track and take advantage of market variations. TrendSpider has algorithms that enable users to access and trade a variety of securities from several asset classes, making it one of the top-charting platforms in the fintech sector.
Since its launch in 2016, TrendSpider has concentrated on offering innovative products to traders as well as diversifying its trading offerings through the addition of multiple products like Crypto Exchanges, forex, and U.S. stocks.
What you'll learn 👉
Features
TrendSpider offers an array of features that may not be available on other tools. The platform was designed with algorithms that complement what active traders know about the market. Below are features that set TrendSpider apart from the rest;
1. Automated Candlestick Pattern Recognition
TrendSpider automatically displays candlestick patterns and other important information on the chart. Users can create automated Fibonacci retracements and support and resistance lines. The platform also displays real-time prices of cryptos, forex, stocks, and ETFs.
2. Automated Trendline Detection
There is a lot of manual work and sometimes guess involved when looking for the right anchor for trendlines. To help minimize the laborious manual, TrendSpider’s application relies on data and in-built algorithms which offer more accurate analysis and strategy development. TrendSpider also allows users to customize their line-drawing styles.
3. Automatic fibonacci retracements
For advanced traders, perhaps the most important feature is the ability to automatically find inflection points in the stock’s price data, upon which they can base their Fibonacci retracements. This removes the manual work and guesswork in identifying peaks and troughs as the platform is able to compute all the data and avail results within seconds.
4. Automatic dynamic price alerts
With TrendSpider, a user gets email and SMS notifications on all technical indicators and candlestick patterns for stocks on their watch list. Users can also get alerts on complex combinations of indicators like candlestick formations, moving averages, lower indicators, and upper indicators among others. You can also mute notifications using the “quiet hours” features.
5. Multi-frame analysis
Multiple time-frame analysis simply means monitoring the same currency pair across different time compressions. TrendSpiders can create trendlines and technical indicators for a secondary timeframe on a single chart, using the multi-timeframe analysis tool. The system allows the user to overlay several timeframes on a single chart to monitor how long-term price and indicator movements interact with shorter-term price action.
6. Trendspider market scanner
The TrendSpider Market Scanner allows users to create a customized Smart Watchlist based on a predetermined technical criterion. The Market Scanners is designed to help users filter through the several symbols for stocks that meet specific requirements. The technical criterion is created based on the same visual interface as the Strategy Tester and Multi-Factor Alerts with support for multiple timeframes.
7. Raindrop charts.
Raindrop charts help users to visualize trade volume throughout a set time period. As opposed to traditional candlesticks Raindrops don’t have an opening or closing prices. Users can use Raindrop charts to monitor demand and supply and how they react to price changes throughout the day. Raindrops are constructed with various sets of indicators including low, high, VWAP, and left VWAP to name a few.
8. Strategy Tester
Every trade move always has some percentage of gambling and testing the waters before fully stepping into the unknown territory may help traders develop well-refined strategies and improve their performance. With the easy-to-use, chart-based backtesting tool, users can technically buy and sell without requiring coding skills. Both amateur and professional traders can leverage this technology to effortlessly build and test their own strategies.
With the Strategy Tester, traders can test how the market behaves when they input a certain set of data, which makes it easier to locate an appropriate market for every strategy.
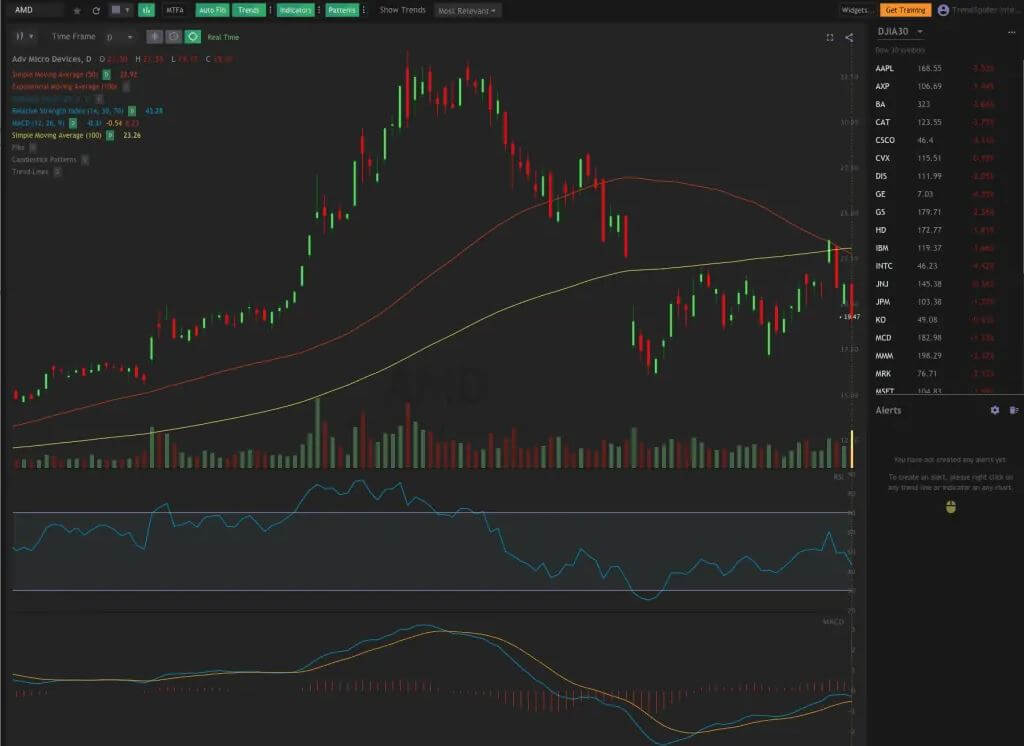
Technical Analysis
In a trading ecosystem, technical analysis means the process of deciding whether a stock will rise or drop in value. It is a type of financial analysis that utilizes charting and mathematical formulas to check and predict the price movements of a stock and the market as a whole. Technical analysis is mainly done by drawing trendlines and resistance points on the candlestick or bar chart.
TrendSpider’s automated technical analysis tool replaces the traditional manual version and offers more accurate timely results. The platform has invested heavily in tools that help users customize their charting experience allowing users to set their own watchlists and alerts for more personalized technical analysis. Key elements of technical analysis include;
- The software offers all the information and data that users need to make strategic trading decisions
- Price tends to move in predictable patterns
- Historical trading data can be used to project future price movements and trading patterns
- The multi-timeframe analysis allows traders to conduct more meaningful long-term analysis and lead to lasting and sustainable trading strategies
- Patterns tend to repeat themselves on multiple timeframes (fractal theory)
- Algorithms make it better, easy, and faster to spot trading patterns as they are not subject to biases, emotions, and social pressure
Read also:
- Best Apps for Trading Crypto
- Best TradingView Alternatives
- Tradelize Review: Is Tradelize Legit or Scam?
- Crypto Portfolio Rebalancing Tools – Is Auto-Rebalancing a Good Idea?
- Best Cryptocurrency Portfolio Trackers – Altcoin Management Apps
- Coinigy review – Multi exchange trading platform
- TabTrader Review – How To Use This Bitcoin Trading App?
- TradingView vs Coinigy Review: Which Crypto Charting Tool is better?
- TradingView Review – Is TradingView Worth It?
- Coinigy vs Altrady – Which Trading Platform Is Better?
- Best Crypto Screeners Apps RIGHT NOW
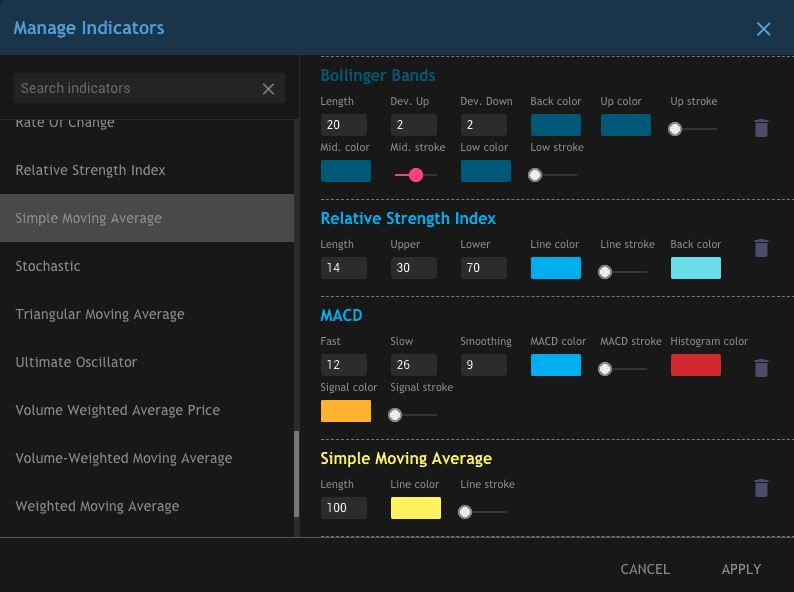
Indicators
TrendSpider allows users to access more than 40 in-built with the ability to even add more. Users can add leading indicators like Bollinger Bands, moving averages, SAR, RSI, and MACD. The multi-frame analysis tool makes it easy for traders to analyze and compare price movements with just a few simple steps. The multi-timeframe analysis is especially touted by industry players as being the next frontier in gathering market intelligence.
TrendSpider Cost
TrendSpider users can choose from three pricing packages depending on their trading interests. Trading interests can be in the form of forex, cryptocurrencies, stocks, and ETFs. In addition to the free package, users can unlock additional features by signing up for either the PRO Trader Plan for $32.50 per month or the ELITE Trader Plan for $48.92 per month.
What Is Automated Charting Software?
The automated Charting software automates the entire process of applying technical analysis saving traders the hassle of having to draw trendlines manually. It is a relatively new tool emerging from the growing sophistication of software programmers.
The automatic charting software ensures that technical indicators are applied using the same pattern and set of rules every single time. This creates consistency in analysis and decision-making, improves efficiency, and eliminates trading errors.
However, some traders prefer to apply their trading knowledge, experience, and prevailing market conditions as opposed to automated robotic charting software. To these traders, automatic charting software is more of an art than a science.
The choice to use automated charting software depends on an individual’s trading requirements and targeted objectives, and largely differs on a case-by-case basis.
TrendSpider’s Automated Charting
TrendSpider’s automated charting software stands out among its competitor’s thanks to its new innovative features. A key feature in its charting platform is the automatic generation of 7 set time periods created with all the attendant technical indicators for every price chart selected.
Day traders don’t need to struggle to select the right time for every analysis but can simply compare and select from 7 fully generated charts. The charting program has an interactive and intuitive generation of the most important technical indicators.
It consolidates all technical indicators that a daytime trader may require including breakout points, resistance levels, and trendlines among others. The automatic charting has an in-built alert system that keeps traders informed of the various price shifts and movements in technical indicators.
Data Sets
TrendSpider allows users to access a variety of data sets for trade analysis. Users can access data on cryptos, ETFs, OTC markets, futures, forex, and equity indices. However, these data sets can only be accessed by premium subscribers with PRO plan subscribers able to access 3 data sets-stocks, ETFs, and cryptos while ELITE plan subscribers are able to access the full range of data sets.
Watch Lists
TrenSpider allows users to create watch lists for various markets in the selected subscription plan. It allows users to create any number of watch lists depending on the theme and allows them to analyze and scan their list or any potential target. With real-time data, users can plot and automate alerts. It also allows traders to evaluate each potential trendline and select the most compelling ones.
Customer Service
TrendSpider offers dedicated customer services to help trades easily navigate the charts and improve their trading experiences. The platform has a robust community of support which traders can rely on for information on technical aspects.
Education and Community Resources
In the current digital and sophisticated trading ecosystem, service providers are offering a wide array of information and educational materials to support traders and simplify their products and operations. While TrendSpider offers a package of learning materials through demo videos, blogs, and one on one training, the platform largely falls behind its competitors in this area.
What makes TrendSpider stand out?
TrendSpider is not only simple and easy to use, but it also has simplified technical analysis tools like the automated Fibonacci retracement feature and the automated trendline tool. These tools are especially important in informing traders’ decisions. The software also enables experienced traders to manually pay with the algorithm to reset trendlines for better results.
The multi-timeframe analysis tool is unique and useful in monitoring support and resistance areas across multiple short timeframes when day trading. Users can also use the dynamic alert on predicted support and resistance zones and adapt as trendlines and indicators change.
Who can use TrendSpider?
TrendSpider serves technical analysts and chartists alike. It is a great learning tool for new traders and charters as well as those just seeking to horn their skills. The tool saves a lot of time for traders performing technical analysis and drawing trendlines.
The technical analysis tool is mainly recommended for traders with enough foundational knowledge of charting and technical analysis. It is not a trading tool that directs trades where to place a trade but simply a system that adds a new layer to the charting experience. It is therefore well-suited for traders that conduct their trading based on technical analysis. TrendSpider is one of the leading innovative charting platforms available on the market.
TrendSpider’s Ease of Use
TrendSpider has a well-built user-forward that works efficiently and reliably. The tool is good to use both to conduct technical analysis and as a learning tool. News users who sign up get dedicated free 1-on-1 phone call assistance from trading experts. This way, you easily master the platform, shorten the learning curve, and generally improve your charting and trading experience.
Final Thoughts
TrendSpider has cut out a unique space in the automated charting software industry with its unique and innovative features, offering cutting-edge market-leading alert and automated charting tools. The software has been designed with the needs of digital traders in mind.