One of the most appealing things about public blockchain finance is that all transactions are recorded openly and verifiable by anyone. In theory, that works. However, in reality, it can be cumbersome to comb through millions of transactions to find information about a single one.
This problem is aggravated when you deal with popular blockchains, like the Ethereum blockchain, for example. If you have some programming knowledge, it might be easier to whip up a code of sorts that will get you your desired information. What about the rest of us that are not programmers? Who is going to help us out in this regard?
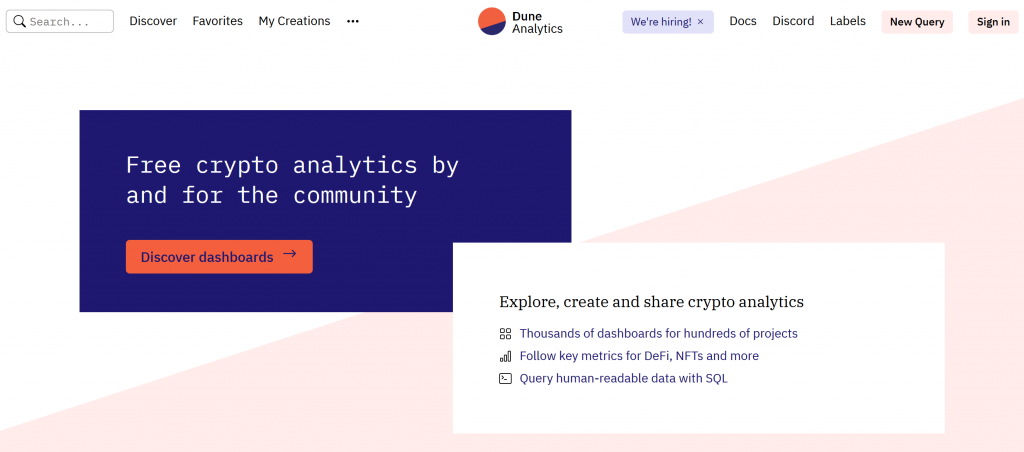
Enter Dune Analytics. It’s a robust blockchain analytics tool that simplifies the process of blockchain research by allowing users to enter simple queries into existing databases. Founded in 2018 with its headquarters in Oslo, Dune analytics focuses mainly on information within the Ethereum network.
In this article, we will break down essential components of Dune analytics and discuss how you can use it to engage in qualitative research.
What you'll learn 👉
DUNE FEATURES
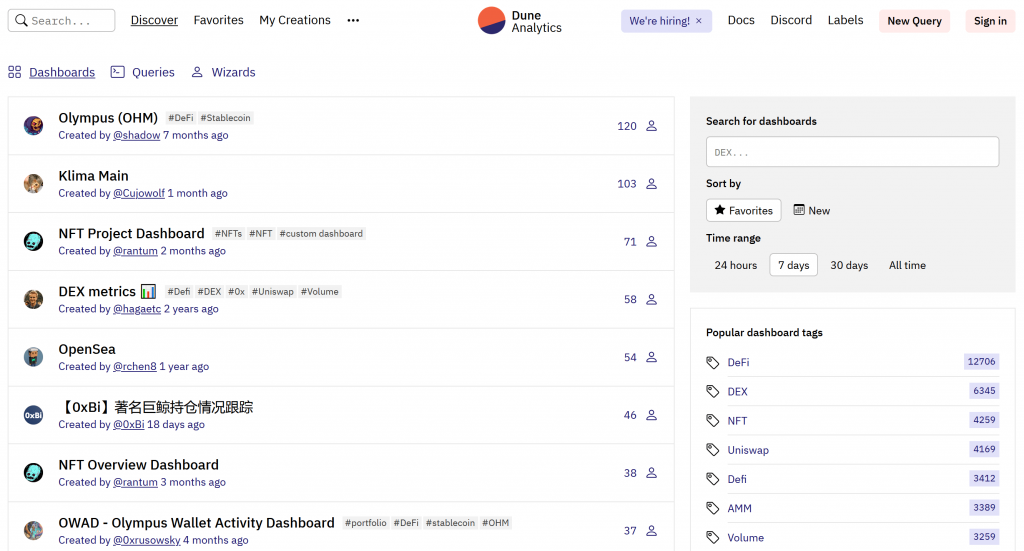
The two most prominent features of Dune analytics are the Queries and the Dashboards. With these tools, you can not only interpret databases efficiently but also create your own databases. Before we discuss how to create your own queries, we will talk about how to build on existing ones:
Popular premade Dashboards
Dashboards are groups of queries and visualizations that previous users have created. They usually center around a specific section of the ETH blockchain. There are lots of dashboards to select from on the Dune interface.
The popular ones are DeFi, DEX, Uniswap, Stablecoin, Bitcoin, ERC-20, Ethereum, MakerDAO, wrapped, etc.
Popular premade queries
Queries are singular entries on the Dune interface asking a question about a specific topic. For example, one person could maybe want to find out information about the first ten transactions on the Ethereum blockchain; that’s a query.
Popular queries are categorized on the Dune analytics page, and you can find premade queries that match your request. It’s like scrolling through the FAQ section of a website. Examples of popular query categories are DEX, Uniswap, lending, trading, etc.
Custom Dashboards:
In the very rare case that you do not find what you’re looking for among the list of premade queries and dashboards, you can create your custom dashboard and start adding queries to it.
WHAT BLOCKCHAINS CAN YOU TRACK ON DUNE ANALYTICS?
From inception, Dune analytics was made for the Ethereum Blockchain. This is because the Ethereum Blockchain is the hub of most decentralized finance initiatives; therefore, massive volumes of transactions in various niches pass through it every second.
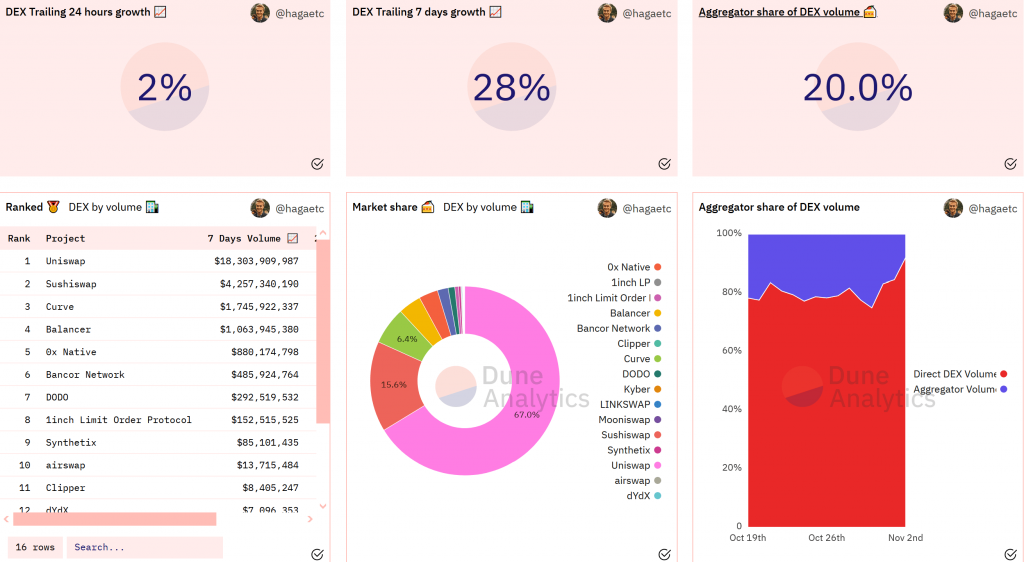
In addition to transactions on the Ethereum mainnet itself, you can also track transactions on projects built on the Ethereum blockchain. Projects like Uniswap, 1inch, Curve, Compound, Optimism, xDai, 0x, BoringDAO, Aave, Balancer, dYdX, MakerDAO, etc.
PRICING
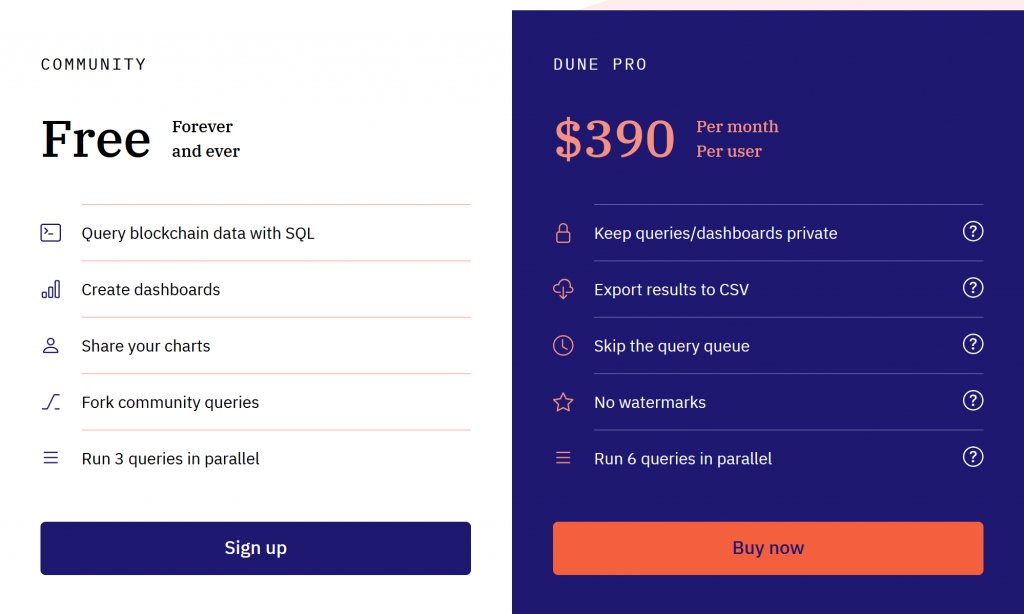
There are two plans on the Dune analytics platform: The free and the pro plans. With the free plan, you can:
- Search queries against existing databases
- Writing new queries if your request is not on the premade queries list
- Create visualizations(like charts, graphs, lines, etc.) and dashboards
- Share your charts for public use and review
- Create forks of preexisting community queries.
- Run three queries in parallel.
The pro plan is at a fixed $390 per month per user. With the Dune Pro plan, you enjoy certain perks, of course. You can:
- Keeps query private. Thus, your queries will be known by you and you alone.
- Remove watermarks from queries and visualizations.
- Export results to CSV
- Get qualitative results without having to wait in a queue
- Run six queries in parallel.
HOW TO USE DUNE ANALYTICS
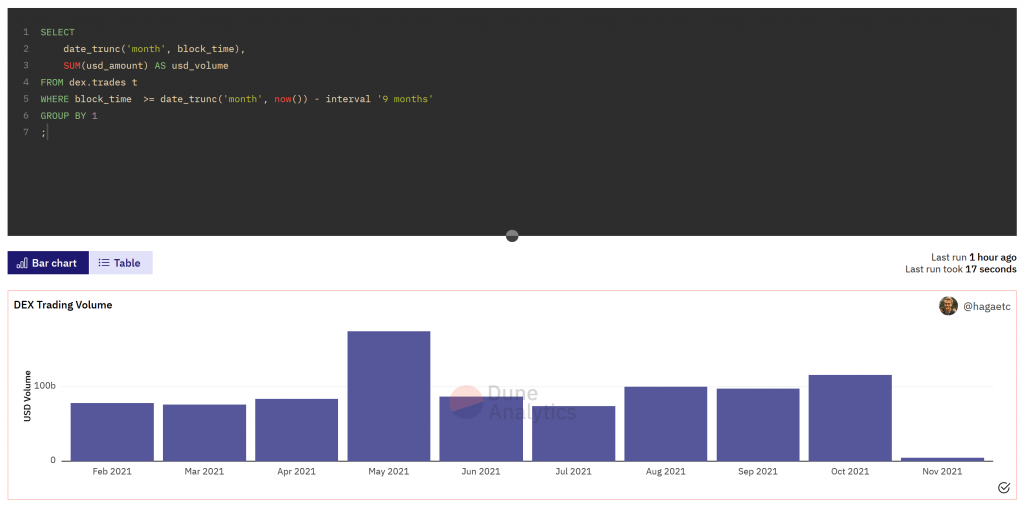
Writing queries on Dune
The Dune analytics program makes it easy enough to write queries from scratch even if you have never written programming code in your life. The easiest way to begin is to fork from an already existing query with slight alterations. This doesn’t have many complications, and it takes less time.
However, if you want to write a query from scratch, you must define what exactly you want to know. This makes it easy to follow through on the specific purpose. After you’ve done that, follow these steps:
- Go to the Dune website and log in
- Select ‘Create’, and then ‘Query.’
- A list of existing specialized SQL tables will pop up. Search for the one closest to your query.
- Click on the selected table to show all the available columns
- Click the double arrow to paste the selected column(s) in the query section
- Press ‘execute’ to run it
- Save your work by pressing Ctrl+S.
- You have created a new query!
Let’s treat an example to make it clearer. If I want to find out about the first five transactions on the Ethereum network, these are the steps I’ll follow:
- I’ll select ‘create’ and then ‘query.’
- A list of specialized SQL tables will be displayed. Tables like:
- ethereum.transactions
- ethereum.logs
- erc20.Erc20_evt_transfer
- prices.layer1_usd, etc.
I will select the first one since it’s the closest to my query
- I’ll click on the table to show all the available columns like hash, index, gas prices, etc.
- I’ll select the particular columns I am looking for and click the double arrow to paste them into the query section.
- Then I’ll press ‘execute’.
- That’s all. I have successfully created a new query.
Making Visualizations
This is another feature of Dune analytics that makes the data even more readable. To illustrate how you can make visualizations with your queries, let’s build on the example above. I have successfully created a query and gotten a list of the first five transactions on the Ethereum blockchain. After that, I will:
- Select ‘new visualization’ from the menu bar
- Select the type of visualization I want. You could choose charts, bars, counters, etc. Let’s say I choose a chart
- Select the X and Y-axis of the chart in question and define the other parameters. It’s easy; just follow through on the screen prompts.
- Choose the style, color, label, etc., of the graph.
- Save.
Read also:
- Altrady Review
- Coinigy Review
- Coinigy vs Altrady
- Best Crypto Trading Tools
- Best Crypto Charting Software & Tools For Bitcoin & Altcoin Traders
- Gocharting Review
- Breakfree Trading Navigator Review
- CryptoView Review
- Messari Review
CONCLUSION
In summary, Dune analytics is a powerful tool for tracking and getting accurate information about various aspects of decentralized finance. With the wealth of queries and dashboards under its platform and the ability to create new queries and dashboards as you see fit, it can be your loyal companion as you swim through the murky waters of blockchain finance.
ALTERNATIVES
Dapp query
Like Dune analytics, this platform also creates databases from data retrieved from the Ethereum blockchain. It’s also similar to Dune in that it offers visualizations to make data more readable and pre-made dashboards.
However, in contrast, it comes with a more interactive UI, with three different plans,s namely: the free plan, the Pro plan ($199 per month), and the Premium plan ($299 per month).
Glassnode
Glassnode is another powerful crypto key metrics tool that makes the process of cryptanalysis much simpler. It has the following features:
- On-chain market indicators like market cap, wallet addresses, on-chain exchange activities, etc.
- Over 200 unique chart metrics are categorized into easily accessible groups.
- It does not only analyze Ethereum. It goes further to include more crypto assets
- It has a function for comparing different coins with available metrics
- It has three payment plans: there is the standard plan(which is free), the advanced plan(which goes for $29 per month), and the professional plan(a whopping $799 per month).
Coinmetrics
The name gives this program away. It is a comprehensive arsenal with over a hundred crypto assets and more than three hundred metrics. It has unique metrics like supply graphs, miner metrics, realized cap, crypto exchange metrics, mining pools, etc., as well as standard ones like volume, MACD, price graphs, etc.
In addition, Coinmetrics also includes the option to export your analytical data to CSV, Excel, and PNG. This is an improvement on Dune analytics which only allows you to export to CSV.
Coin360
This is the most straightforward of them all. It displays all the supported cryptocurrencies in a single tab with sizes proportional to their market cap dominance. It also uses a color code, depicting rising crypto assets as green and falling crypto assets as red.
You can create watchlists to track your favorite coins using different criteria. To add sugar to honey, this tool is entirely free and accessible to everyone.

