
Glassnode Review – Pricing, Metrics, Charts in Overview
Glassnode is a cryptanalysis platform that generates intelligent data by observing on-chain indicators, i.e., information gotten from the blockchains themselves. It was founded in Germany in 2018 and had its headquarters in Zug, Switzerland.
A valuable tool in the crypto sphere, it helps individuals stay level-headed even amidst the turbulent waters of crypto trading. It also helps blockchain teams with qualitative insights on their projects and tokens.
In this article, we will learn about its various features, its pros and cons, and some alternatives.

| Topic | Description |
|---|---|
| 🌐 Glassnode Overview | A leading blockchain data and intelligence platform offering data and insights for trading, risk management, and research in digital asset markets. |
| 📊 On-Chain and Financial Market Data | Provides thousands of metrics for Bitcoin, Ethereum, DeFi, stablecoins, top cryptocurrencies, and derivatives, along with comprehensive exchange data and a high-performance API. |
| 🔍 Market Insights | Tools and expert analysis for unique market insights, with curated dashboards, high-signal charts, and custom indicators for data-driven decision-making. |
| 📈 Data and Analytics Solutions | Tailored for institutional needs, covering Quantitative Trading, Exchange Risk Management, and Discretionary Trading, with deep datasets and real-time risk monitoring. |
| 🔬 Research & Content Creation | Enables crafting narratives with rich data, offering in-house research and insights, and a quick-query API for accelerated research. |
| 📉 Charts and Workbench | A suite of on-chain and financial charts for actionable insights, with a user-friendly tool for creating custom charts and discovering trading signals without coding. |
| 🚨 API and Alerts | High-performance API for enhancing models and strategies, with advanced alerts for charts via email or Telegram. |
What you'll learn 👉
GLASSNODE FEATURES
STUDIO
The Glassnode studio is a comprehensive studio that acts as the powerhouse of glassnode’s entire arsenal. Here, you can get access to a categorized list of all the main metrics, each of them focusing on a particular aspect of the crypto world.
The studio contains metrics for addresses, derivatives, entities, exchanges, lifespan, miners, OTC desks, profit and loss ratios, markets, unspent/spent outputs, volume, ratios, institutions, etc., with more detailed examples when you click on them.
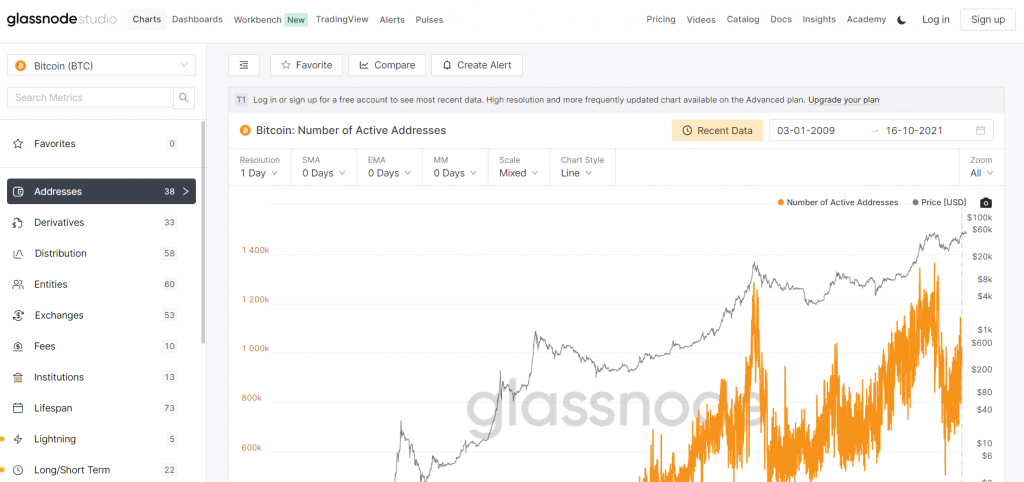
For example, if you click under ‘addresses,’ you will be introduced to 38 new metrics under that subsection, making it easier for you to pinpoint what exactly you’re looking at. Metrics like sending addresses, receiving addresses, addresses with a balance greater than $100k, new addresses, etc., make it easier to find customized information for research purposes.
INSIGHTS
These are well-researched articles drawn from actionable intel from the blockchain data itself. They are often technical and may be difficult for someone just getting acquainted with the crypto world to understand. However, for those who know their way around the crypto world to an extent, this tool is a source of informative goodness.
There are currently six sections under the insights in the Glassnode website. There is a newsletter section that is updated weekly for every week of the year and an insights section providing professional viewpoints into specific topics, an analysis section, a reports section, a products section, and a DeFi section.
ACADEMY
The Glassnode academy is an education platform for both early adopters and newbies to get acquainted with the goings-on in the crypto world. It offers a qualitative explanation of various on-chain metrics as well as their different functions and use cases.
The section starts with a glossary of on-chain terms. It goes on to include articles about unspent transaction outputs(UTXOs), supply metrics, indicators, concepts, and marks, with 21 articles in all.
METRIC CATALOG
The Glassnode platform is blessed with a very comprehensive library of metrics that make it one of the best in the world of crypto analytics. The metrics are divided into three tiers, with more detailed information as you go up to tier levels. Examples of metrics under each tier are:
- Tier 1: Active addresses, block height, sending addresses, block size, blocks mined, unspent transaction outputs(UTXO), new deposits, etc.
- Tier 2: Addresses with specific native balances(e.g., more than 1 BTC, etc.), DeFi Total Value Locked(TVL), Futures open interest, futures volume, exchange balances, coin years destroyed, liveliness, etc.
- Tier 3: Addresses with specific dollar balances(e.g., more than $10k, etc.), supply held, withdrawing addresses, miner balance, new entities, unspent miner supply, SOPR(spent output profit ratio), etc.
TOP TEN ON-CHAIN INDICATORS IN GLASSNODE
MVRV Ratio
The MVRV ratio is a ratio of the market value of a coin to its realized value. It’s a valuable tool that, when combined with other metrics, can accurately predict market tops and bottoms.
For example, when this value is high, that is an indication that the coin is overbought, indicating a potential market top. On the other hand, when it is low, it may mean a coin is oversold, showing a possible market bottom.
Coin days destroyed
This metric measures the activity of older investors whose coins have laid dormant for some time. It is gotten by multiplying the coins that moved out of a wallet by the number of days it had remained static in the wallet. Analyzing this metric can reveal when whales are about to sell, thereby inspiring a profit-taking period.
LTH/STH ratio
This is the ratio of the long-term holders of a coin to its short-term holders. This metric helps us know who exactly is selling and whether there is cause for panic or not.
Realized profit/loss
This metric is used to determine if a coin still has some steam left in it after a recent run upwards or if it might be time to exit the market and take profit.
SOPR (Spent Output Profit Ratio)
It is another market indicator that shows the profit/loss ratio of coins moved from their addresses
Stock to Flow ratio
The stock to flow ratio of a coin is the ratio of the new supply to the existing supply. It is usually used to predict the price of a currency and has proven to be one of the most accurate methods of doing that.
Volatility ratios
The Bitcoin volatility index is only available to those who have subscribed to an advanced plan. It measures the volatility of bitcoin to determine settlement prices for bitcoin volatility futures.
NVT(Network Value to Transaction ratio)
It is an indicator that establishes the ratio between the transfer volume of a coin and its market cap. It helps determine if a currency is overvalued or underpriced.
Ribbons
The Bitcoin difficulty ribbon is a graph depicting the difficulty of mining Bitcoin. It is used to know when it’s best to buy Bitcoin.
Stablecoin Supply
This indicator is also important as it shows if/when people are ready to buy crypto with stablecoins.
VARIOUS CHART METRICS
As mentioned earlier, there are hundreds of chart metrics on Glassnode divided into three tiers, with the higher tier being more detailed than the one before it.
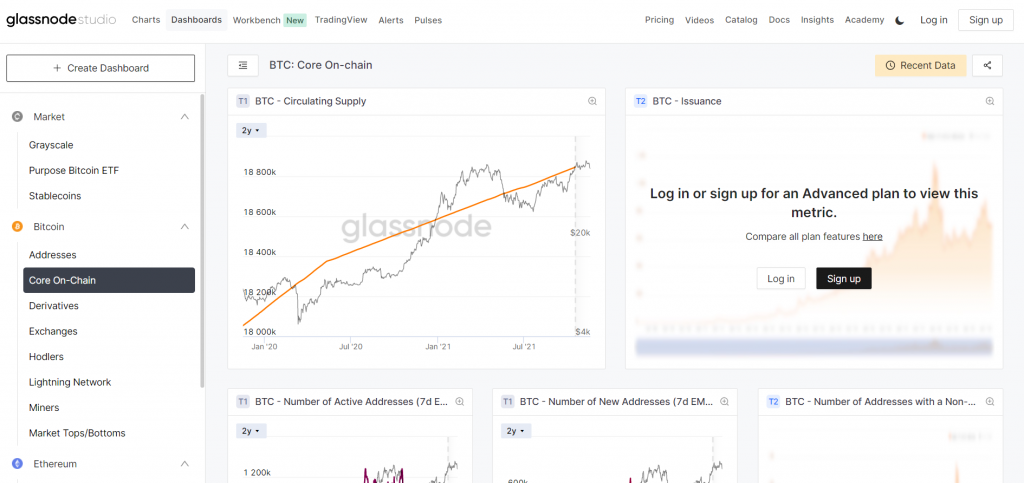
MULTIPLE DASHBOARDS
Another exciting feature of Glassnode is that you can create your own customized portion of the studio. By using a dashboard to organize your favorite coins and metrics according to preference, you make it easier to find what you’re looking for when you come back next time.
COMPARING COINS
Here, you can combine the metrics for two or more crypto assets and create an over-layered chart for them
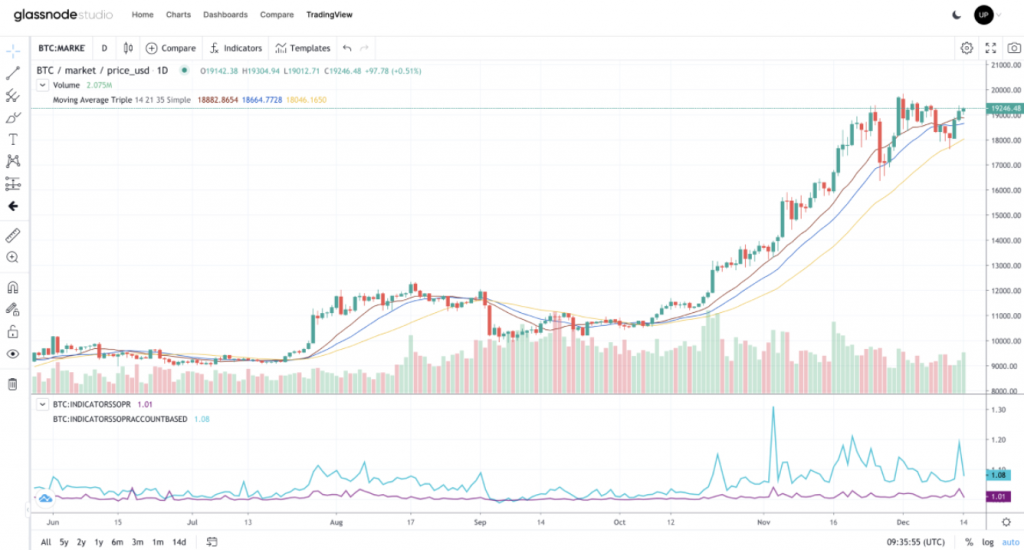
TRADINGVIEW INTEGRATION
It’s a beta program where you can integrate your TradingView pro chart editor with thee Glassnode studio, opening the doors to further editing tools and metrics
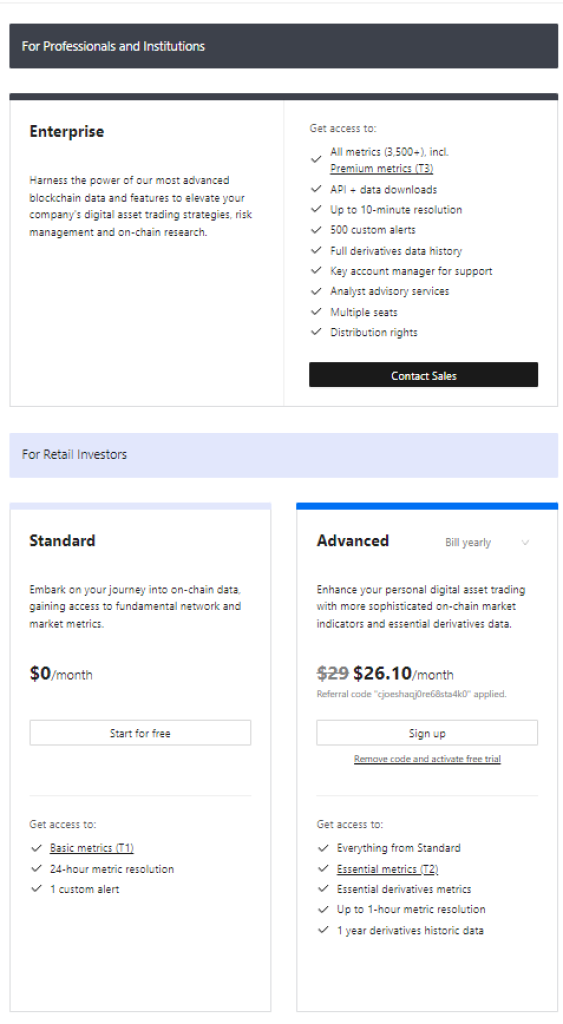
Glassnode Pricing
There are two paid plans on Glassnode. The first one is Advanced, currently priced at $26.10/month and another one is Enteprise that have more features and price is customized.
There’s also a Standard plan and this one is currently free of charge.
CONCLUSION
There is no doubt that Glassnode is one of the most comprehensive data analysis tools for crypto available. It has practically everything you need to know to make logical trade decisions. Hopefully, this article has shown you if it is for you or not. If you don’t like it, check the list of alternatives at the end of this article.
- It doesn’t come with a watchlist
- There is no alert system
- It could be too technical for beginners to understand.
ALTERNATIVES
CRYPTOQUANT
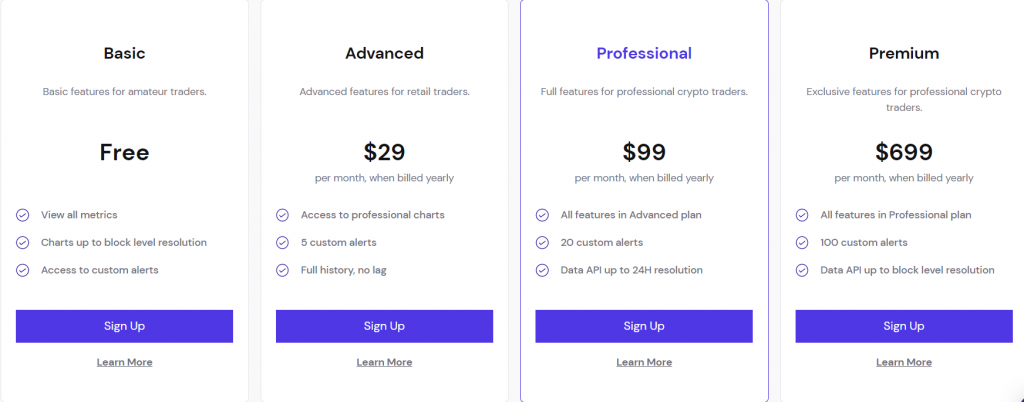
It was founded in Korea in 2018 and is an equally comprehensive source of crypto analytics data. It offers quick takes in place of insights and an alert system that works on telegram, browser, and email. Also, it has three paid plans($29, $99, and $699). Here is a full Cryptoquant review.
INTO THE BLOCK
It is an AI-based analytics platform that offers price prediction services, DeFi analytics, and market analytics. It’s much cheaper than the others as it comes with only one plan – $10 monthly or $8.33 if paid yearly. It doesn’t come with a free plan but offers a 7-day free period before charging the customer’s account. Subscription can be done in either fiat or crypto.

MESSARI
Messari is a crypto data analysis platform created in New York in 2018. It employs charts, watchlists, screeners, and reports to produce qualitative data to guide investors in decision-making. There is a seven-day free trial period after which users will choose whether to go with a $29.99 monthly plan for individuals or a $1,125 monthly plan for enterprises. Payment can be made in USD or crypto.


WARNING about Glassnode – With the $29 / Month advanced plan the majority of the metrics that you will want to use are almost useless because these metrics only plot back on the chart for the past 1 month. And since On-chain analysis is more for longer time frames the metrics plotted on the chart does not go back far enough for comparison or for the metric to be useful. Definitely check this out and only pay for one month to try it out, Don’t buy for the full year until you try it out and see what i mean. If you buy for 1 year you will save $10 per month which gets it down to $29/month. but try it out for 1st month before you commit. Its understandable that with the lower tier “Advanced” plan you won’t get all the really advanced metrics which is fair at this cheaper price point. But the most popular metrics included with this plan only plots on charts for the last 30 days and quite useless for the majority of your charting. They are making a big mistake to limit the historical plotting of the metrics on our charts. I left and had to go to their competition, which basically has the same metrics and same plans, but they don’t have the historical/time limitations for the most popular metrics in their $29/month plan.