
Ethereum, XRP, and Cardano enter September 5 with their prices trapped inside consolidation structures after yesterday’s US nonfarm payroll release brought fresh volatility. None of the 3 cryptocurrencies has made a convincing breakout from its current range, which leaves several important levels in play today.
Ethereum price has returned toward the middle of its broader range, XRP price remains close to an important support area, and Cardano price has pulled back from yesterday’s peak. Technical indicators also present a mixed picture across all 3 assets, with MACD readings remaining positive even as other momentum indicators point to continued selling pressure.
That combination could make today’s key support and resistance levels particularly important. Here is what the charts and technical indicators show for Ethereum, XRP, and Cardano.
What you'll learn 👉
Ethereum Price Remains Inside Its Larger Consolidation Range
Ethereum price continues to trade inside a broader consolidation structure between $2,350 and $2,540. Yesterday’s price action brought ETH back into the middle band after another unsuccessful attempt to establish a stronger move near the upper part of the range.
The US nonfarm payroll release pushed Ethereum price down toward $2,430. ETH later recovered slightly and has since traded sideways between roughly $2,444 and $2,459.
Current momentum could keep Ethereum inside the middle section of its consolidation, where $2,415 and $2,490 form the main boundaries. A stronger decline below $2,415 could expose the lower region around $2,356.
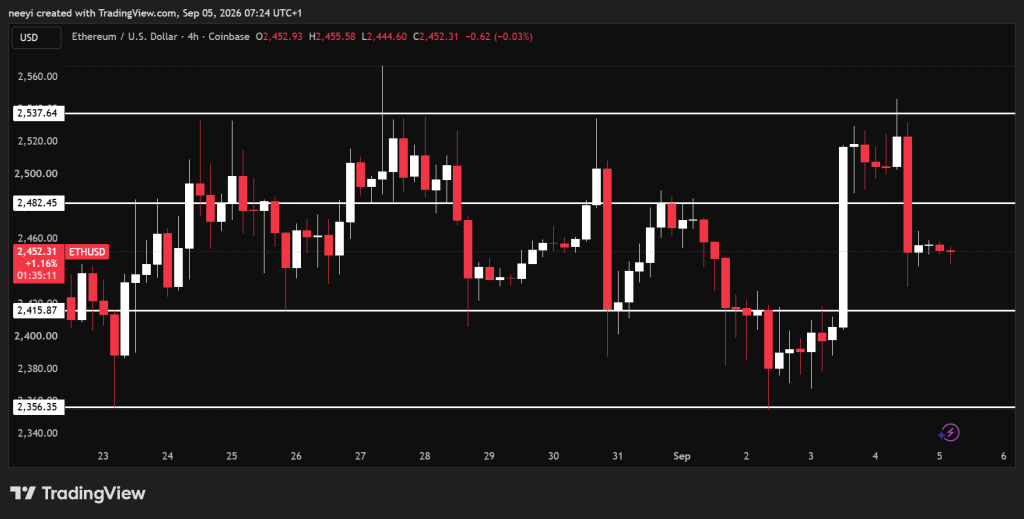
Ethereum bulls need a different outcome to regain control. A break above roughly $2,482 could open the path toward $2,537 before the day ends.
Ethereum’s technical indicators offer a mixed reading. The RSI stands at 50.124, which places ETH almost directly in neutral territory. Buyers and sellers therefore have no clear momentum advantage based on RSI alone.
MACD provides the strongest positive reading at 4.23. The positive MACD reading favors buyers and supports the possibility of another attempt toward resistance if Ethereum price can remain above nearby support.
The Ultimate Oscillator stands at 40.315 and carries a sell reading. That level indicates weaker underlying momentum and makes an immediate upside breakout less convincing.
Bull/Bear Power is also negative at -13.3439. Sellers therefore retain some control over short term price action despite the positive MACD reading.
| Indicator | Value | What The Reading Means |
|---|---|---|
| RSI(14) | 50.124 | Momentum remains balanced without a clear advantage for buyers or sellers |
| MACD(12,26) | 4.23 | Positive momentum gives buyers some support for another resistance test |
| Ultimate Oscillator | 40.315 | Weaker momentum keeps downside pressure relevant |
| Bull/Bear Power(13) | -13.3439 | Negative power shows sellers still have some control |
Ethereum Price Prediction for Today, September 5
- Bullish scenario: Ethereum price breaks above $2,482 and moves toward the upper region around $2,537.
- Neutral scenario: ETH remains inside the middle consolidation band between roughly $2,415 and $2,490.
- Bearish scenario: Ethereum loses $2,415 and moves toward the lower support region around $2,356.
XRP Price Consolidation Keeps $1.37 And $1.47 As Key Levels
XRP price has a similar structure heading into September 5. The cryptocurrency remains inside a broader consolidation pattern that can be separated into lower, middle, and upper regions.
Yesterday’s attempt to enter the upper band failed. The nonfarm payroll release then pushed XRP down toward $1.38 before the price stabilized.
Current conditions leave $1.37 and $1.47 as important boundaries today. Continued sideways movement could keep XRP price inside that range.
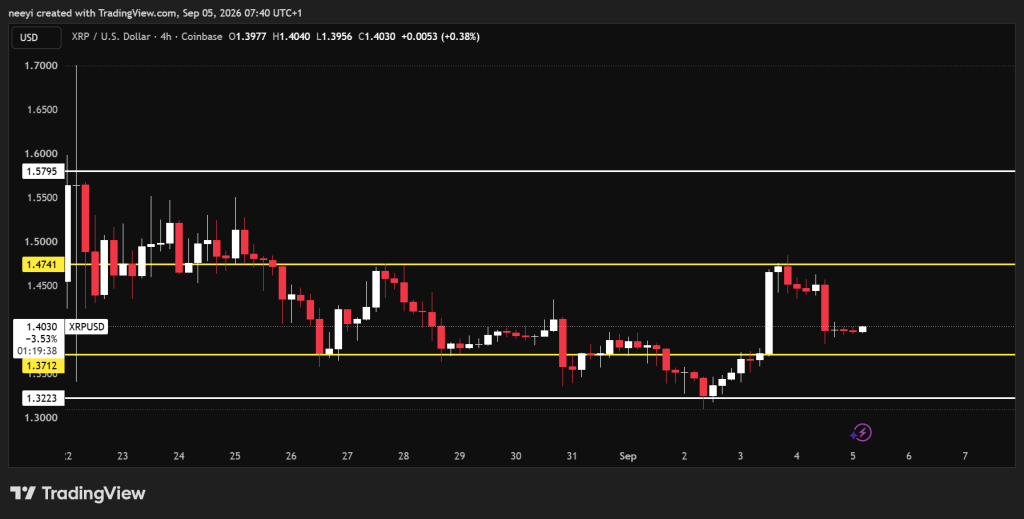
A convincing move above $1.47 would change the short term structure and could open the path toward $1.57. Losing $1.37 would create the opposite setup and could expose support around $1.32.
XRP’s RSI reading of 51.238 is almost neutral. The reading is slightly above the midpoint, although it does not provide enough strength to confirm that buyers control the market.
MACD stands at 0.006 and carries a positive reading. That gives XRP some underlying bullish momentum and could become more important if price tests $1.47 again.
The Ultimate Oscillator comes in at 44.312. Its sell reading shows that broader momentum remains weaker than the MACD alone indicates.
Bull/Bear Power stands at -0.0052. The negative figure also favors sellers slightly and helps explain why XRP price has struggled to establish a stronger recovery.
| Indicator | Value | What The Reading Means |
|---|---|---|
| RSI(14) | 51.238 | Momentum remains close to balanced despite a slight advantage above 50 |
| MACD(12,26) | 0.006 | Positive momentum supports the possibility of another upside attempt |
| Ultimate Oscillator | 44.312 | Momentum remains weak enough to keep downside risk open |
| Bull/Bear Power(13) | -0.0052 | Sellers retain a small advantage based on this indicator |
XRP Price Prediction for Today, September 5
- Bullish scenario: XRP price breaks above $1.47 and makes a move toward $1.57 before the end of the day.
- Neutral scenario: XRP continues consolidating between approximately $1.37 and $1.47.
- Bearish scenario: XRP loses support around $1.37 and moves toward the next important level near $1.32.
Cardano Price Faces Bearish Pressure Near $0.208 Support
Cardano maintains a similar consolidation structure, although its immediate price direction looks weaker than Ethereum and XRP.
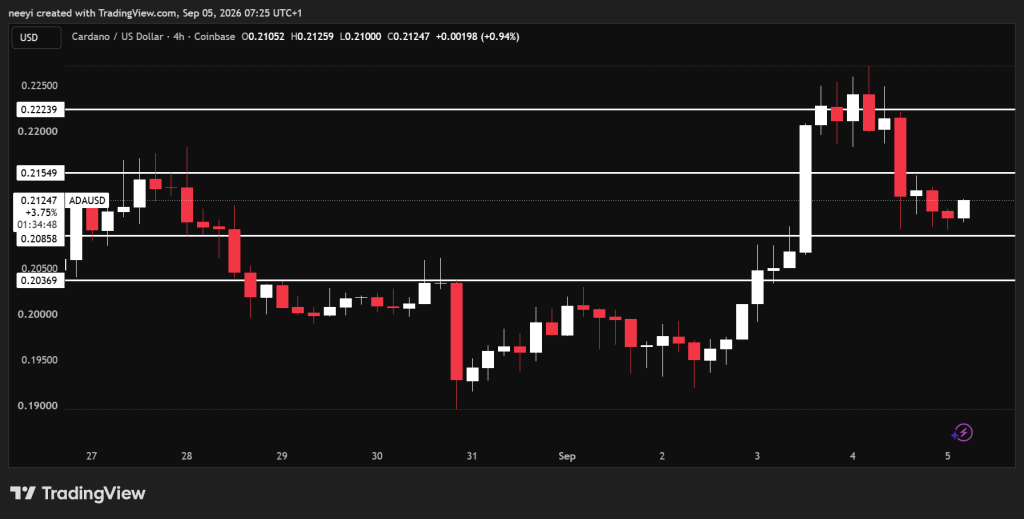
ADA reached approximately $0.22 yesterday before moving lower. Cardano price currently trades around $0.212, which places the cryptocurrency close to an important support area.
The $0.208 level could determine whether the current decline extends further. A break below that area could expose $0.203, which forms the next important level within the broader consolidation structure.
Buyers need Cardano price to reclaim $0.215 to improve the short term setup. Breaking above that resistance could allow ADA to revisit yesterday’s $0.22 region before the end of the day.
Cardano’s RSI currently stands at 53.168. That reading remains neutral, although its position above 50 gives buyers a small momentum advantage.
MACD stands at 0.003 and provides another positive reading. This means ADA still has some bullish momentum underneath the recent decline, although price needs to reclaim resistance before that reading becomes more convincing.
The Ultimate Oscillator stands at 44.14 and carries a sell reading. That indicates weaker momentum across multiple time periods and supports caution around the current decline.
Bull/Bear Power comes in at -0.0012. Sellers therefore maintain a small advantage despite the neutral RSI and positive MACD.
| Indicator | Value | What The Reading Means |
|---|---|---|
| RSI(14) | 53.168 | Momentum remains balanced with a small advantage toward buyers |
| MACD(12,26) | 0.003 | Positive momentum leaves room for another recovery attempt |
| Ultimate Oscillator | 44.14 | Weaker momentum keeps the risk of another decline open |
| Bull/Bear Power(13) | -0.0012 | Negative power gives sellers a slight short term advantage |
Cardano Price Prediction for Today, September 5
- Bullish scenario: Cardano price breaks above $0.215 and moves toward yesterday’s region around $0.22.
- Neutral scenario: ADA remains between approximately $0.208 and $0.215 as consolidation continues.
- Bearish scenario: Cardano loses $0.208 and moves toward the next support area around $0.203.
FAQs
Subscribe to our YouTube channel for daily crypto updates, market insights, and expert analysis.