
Cardano price has returned to a familiar technical setup after another pullback inside its broader recovery structure. ADA now trades around $0.20, and a fresh Tom DeMark Sequential buy signal has appeared on the daily chart.
That signal matters because similar readings appeared near several recent Cardano bottoms before sizable rebounds followed. The current price structure also supports the possibility of another move higher if ADA continues forming higher highs and higher lows.
A look at the Cardano price chart shows a clear higher high and higher low structure that started near the end of July.
ADA first formed a low around $0.138 before climbing toward $0.199. The price later pulled back toward approximately $0.153, which remained above the previous bottom.
Another rally then carried Cardano toward $0.21 before ADA returned toward approximately $0.170. That level again formed a higher low.
Cardano later climbed toward $0.258, which became the latest major higher high. ADA has since pulled back toward approximately $0.189 before recovering to the current area around $0.20.
Cardano (ADA) reaching $10 is considered unlikely by mainstream analytical models in the near term, though some crypto analysts view it as a long-term possibility during a major bull cycle.
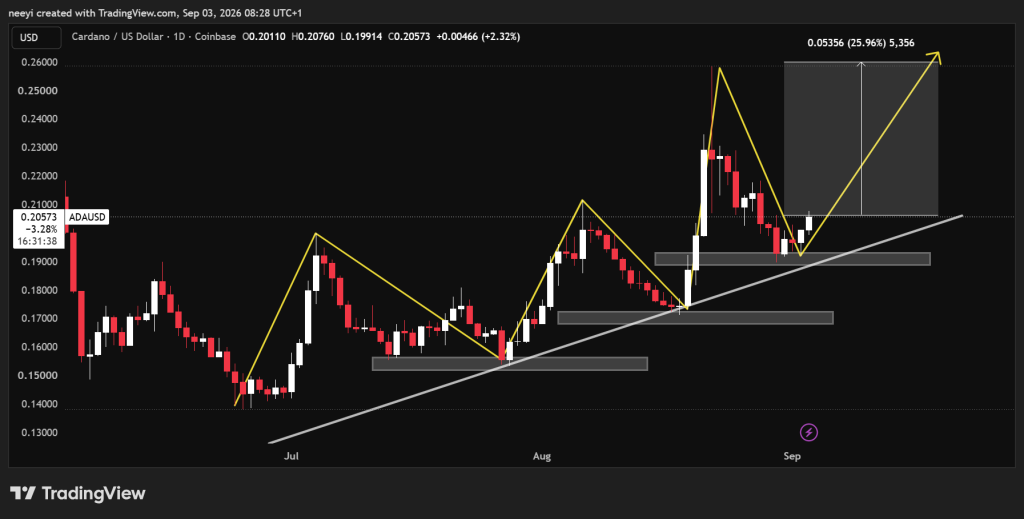
The sequence can be summarized like this:
- ADA bottomed around $0.138 before reaching $0.199.
- The next low formed around $0.153 before price climbed toward $0.21.
- Another higher low appeared around $0.170 before ADA reached $0.258.
- The latest major bottom has formed around $0.189.
This structure remains technically constructive as long as the higher low sequence remains intact.
What you'll learn 👉
ADA Could Retest $0.258 if the Current Pattern Continues
The next major question involves where Cardano price could move if the existing structure continues.
ADA has already recovered from around $0.189 to approximately $0.20. A continuation of the higher high pattern would require the price to eventually move above the previous peak near $0.258.
Such a move would represent an increase of roughly 40% from the recent $0.189 bottom. The upside from the current price around $0.20 would still be more than 25% if ADA returns above $0.258.
The technical setup therefore favors a possible continuation toward that area if buyers maintain control.
The strongest entry based purely on this pattern would have appeared closer to the recent bottom several days ago. ADA has already moved away from that level, which means the potential percentage return from the current price has become smaller.
Cardano could still have room to move higher if the trend continues through the coming days or weeks. A move above $0.258 would confirm another higher high and strengthen the existing market structure.
Tom DeMark Sequential Buy Signal Has Marked Recent Cardano Bottoms
Ali Charts noted that the Tom DeMark Sequential has produced another buy signal on Cardano’s daily chart.
Recent examples have produced notable rebounds after the indicator appeared.
The June 25 signal came before a 44.5% rally. The July 15 signal came before an 11.5% move, and the August 18 signal appeared before a 50.9% rally.
CARDANO: BUY SIGNAL
— Ali Charts (@alicharts) September 2, 2026
The Tom DeMark Sequential has just flashed a new buy signal on Cardano's daily chart.
These signals have done an excellent job identifying recent bottoms:
• June 25: +44.5% rally
• July 15: +11.5% rally
• August 18: +50.9% rally
Now the indicator is… pic.twitter.com/dAnEKn1vID
Those historical readings do not guarantee another similar move. They do show that the indicator has identified several important Cardano price bottoms during the recent market cycle.
The new signal therefore becomes more interesting when combined with ADA’s higher high and higher low structure.
Cardano’s latest low near $0.189 also remains above the previous major low around $0.170. That keeps the bullish structure intact unless ADA loses the trend support that has guided the recent recovery.
Cardano Daily Indicators Mostly Favor Buyers
Cardano’s daily indicators currently lean positive, although one momentum reading remains weaker.
The RSI stands at 55.086, which places Cardano above the neutral 50 level. Buyers therefore have a modest advantage without pushing ADA into overbought conditions.
MACD stands at 0.003 and remains positive. This reading supports the current recovery and shows that medium term momentum currently favors buyers.
The Ultimate Oscillator reads 47.162. This indicator remains below the neutral area and provides the weakest signal among the 4 readings.
Bull Bear Power stands at 0.0048 and remains positive. Buyers therefore retain an advantage based on this measure of bullish and bearish pressure.
| Indicator | Value | Technical Reading |
|---|---|---|
| RSI (14) | 55.086 | Buyers have a moderate advantage above the neutral 50 level |
| MACD (12,26) | 0.003 | Positive momentum currently supports the recovery |
| Ultimate Oscillator | 47.162 | Momentum remains slightly weak below the neutral area |
| Bull Bear Power (13) | 0.0048 | Positive pressure currently favors buyers |
The overall indicator picture therefore leans bullish. RSI, MACD, and Bull Bear Power support buyers, whereas the Ultimate Oscillator remains the main weaker reading.
Cardano Moving Averages Show a Mixed Longer Term Picture
Cardano’s moving averages provide another useful view of the current setup.
The 50 day simple moving average stands around $0.1869. ADA currently trades above this level, which gives the shorter term trend a positive technical reading.
The 200 day simple moving average remains much higher around $0.2198. Cardano still trades below that level, which means the broader trend has not fully turned bullish.
| Moving Average | Simple Moving Average | Technical Reading |
|---|---|---|
| MA50 | $0.1869 | ADA trades above this level, which supports the shorter term recovery |
| MA200 | $0.2198 | ADA remains below this level, which keeps longer term resistance active |
The difference between both averages explains why the Cardano setup remains constructive without becoming completely bullish.
ADA trading above the MA50 supports the current recovery. A move above the MA200 near $0.2198 would provide a stronger technical confirmation and could improve the case for another test of $0.258.
Cardano Price Could Still Gain More Than 25% From Current Levels
Cardano’s latest price structure leaves $0.258 as the most important higher high to watch.
ADA would gain roughly 40% from the recent bottom around $0.189 if price eventually moves slightly above that previous peak. Buyers who entered closer to the recent bottom would therefore have more upside exposure from that level.
The potential increase from the current price around $0.20 remains above 25% if Cardano returns to $0.258 or moves beyond it.
That scenario depends heavily on the higher high and higher low pattern remaining intact. The current Tom DeMark Sequential buy signal, positive RSI, positive MACD, positive Bull Bear Power, and price position above the MA50 all support the bullish case.
The MA200 near $0.2198 remains an important hurdle before Cardano can challenge the previous $0.258 peak. ADA’s reaction around that moving average could provide the clearest indication of whether this latest buy signal develops into another major rebound.
FAQs
Subscribe to our YouTube channel for daily crypto updates, market insights, and expert analysis.