
XRP’s current selloff looks brutal on the surface, but CasiTrades believes traders may be focusing on the wrong part of the chart.
Her latest long-term XRP analysis argues that the broader bullish cycle that began with the 2024 breakout near $0.50 is still intact.
In her Elliott Wave count, the rally that carried XRP to its recent all-time high was only Wave 1 of a much larger structure.
That would make the decline happening now a higher-degree Wave 2 correction.
And if that count is correct, the next phase would be Wave 3, typically considered the strongest and most aggressive part of an Elliott Wave impulse.
What you'll learn 👉
XRP’s Current Drop Still Fits the Larger Bullish Structure
The chart stretches back to 2024 and shows XRP breaking out from around $0.50 before producing a five-wave advance into the multi-dollar region.
CasiTrades marks the recent high near the $3.60-$3.70 area as the completion of that first large impulsive wave.
Since then, XRP has been retracing that move.
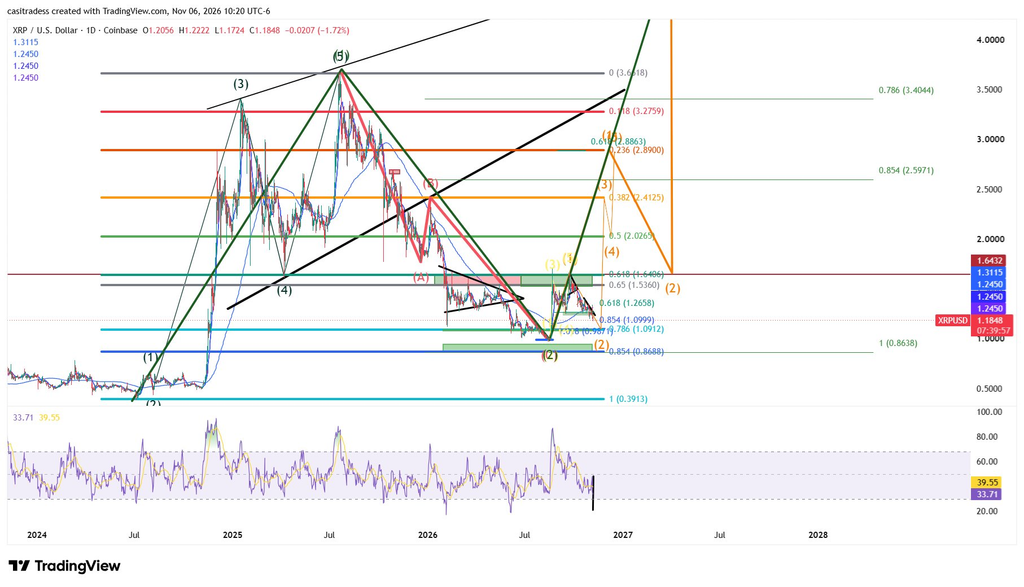
Her chart places several important Fibonacci zones beneath the market, including roughly $1.27, $1.10, $0.99 and the deeper $0.87 area.
That means her bullish thesis does not require XRP to reverse immediately from current levels around $1.18.
In fact, a deeper move into the low-$1 region could still fit the same Wave 2 structure.
That is an important distinction.
The current decline can look extremely bearish on a daily chart and still remain corrective on the larger time frame.
Why the $1.10-$0.87 Zone Matters
The chart shows the most interesting support cluster between approximately $1.10 and $0.87.
One Fibonacci level sits near $1.09, while another deeper retracement appears around $0.87.
Those zones matter because Wave 2 corrections can be deep before the next impulsive advance starts.
The lower XRP travels, however, the more important the reaction becomes.
A fast flush followed by stabilization and improving momentum would support the idea that sellers are becoming exhausted.
Continued weakness without any sign of a base would make the bullish count less convincing.
Her RSI panel is already moving toward oversold territory, with the latest reading around the low-30s.
That does not automatically create a bottom, but it means XRP is entering the type of momentum environment where a reversal signal can eventually develop.
Read also: XRP Price Could Be Headed to $1.10 After This Failed Bounce!
What Would Wave 3 Look Like?
CasiTrades’ chart becomes much more aggressive after the correction ends.
The projected path first sends XRP back toward the $1.60 area, then through approximately $2.00, $2.40, $2.90 and above $3.20.
Those are not random targets.
They line up with Fibonacci retracement and extension levels shown across the chart.
The larger green projection then extends beyond the previous high.
That is the essence of her thesis: the previous all-time high was not the final top of the cycle, but only the first major wave.
If XRP eventually confirms that structure, Wave 3 would be expected to travel significantly beyond Wave 1.
But there is still a lot of work to do first.
XRP would need to complete the current correction, recover above roughly $1.25-$1.30, reclaim the $1.60 region and then begin building higher highs again.
For more crypto news and price predictions, click here.
Subscribe to our YouTube channel for daily crypto updates, market insights, and expert analysis.