
Bitcoin’s struggle around a key support zone has put the next potential bottom back in focus. The supplied price analysis places BTC near a level that could decide whether the latest decline ends with a recovery or extends into a deeper correction.
Jayson Casper’s analysis offers several possible areas where buyers could return. Crypto Millie also presents a case for a correction within a broader bullish outlook. Neither view makes an immediate recovery certain, and the difference between a temporary bounce and a durable bottom will matter.
The clearest way to assess this Bitcoin price crash is to follow the support levels in order. Each failed defense would bring a lower target into play.
What you'll learn 👉
Bitcoin Price Faces A Crucial Test Around $80,500 To $80,600
Bitcoin price chart identifies $80,500 to $80,600 as the immediate support zone.
BTC is described as attempting to break below this area, although a decisive loss of support remains the condition for further downside.
That distinction matters because a brief move below support can reverse. A sustained breakdown would leave a weaker structure and make the next lower support more relevant.
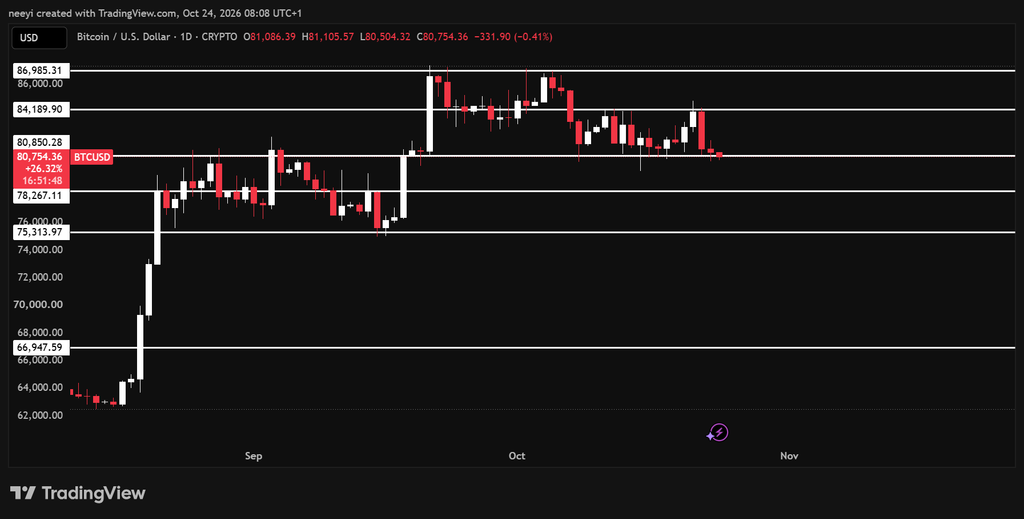
The first downside target in this analysis is approximately $78,260. That level could come into play during the weekend if Bitcoin cannot recover the immediate support zone. The timing remains a scenario, and the price would still need to follow through below support.
A successful defense would keep a recovery toward $86,000 possible. Bitcoin therefore has 2 competing paths around the same area, and the reaction near $80,500 to $80,600 provides the first test.
Jayson Casper Identifies Lower Bitcoin Support Near $77,000 And $75,000
Jayson Casper’s video, “CRYPTO MARKET WARNING! Don’t Trust This Bitcoin Bounce Yet!”, also describes the possibility of another decline before a more convincing recovery.
Casper discusses a move below approximately $79,300 and identifies another potential support area around $76,000 to $77,000. His analysis uses Fibonacci levels and previous trading ranges to identify places where a reaction could develop.
Those levels broadly overlap with the lower support sequence in the accompanying analysis. They do not establish an exact bottom, but they help narrow the areas that could become relevant after an initial breakdown.
Casper also describes a possible move below $75,000 followed by a recovery above it. That would be a different outcome from Bitcoin losing $75,000 and remaining underneath it.
A quick reclaim could indicate that sellers failed to maintain control below support. Continued weakness beneath the same level would leave the deeper downside scenario open.
His central condition is confirmation through price behavior. Reaching a support level alone would not satisfy the requirements he describes for a potential entry.
Losing $75,000 Could Return BTC To Its Previous Trading Range
The accompanying analysis treats $75,000 as an important boundary. A failure there could send Bitcoin back into the $66,000 to $75,000 range identified in the brief as a previous trading area.
That outcome would carry a different implication from a short decline toward $78,260. Bitcoin could return to a broader sideways range instead of quickly resuming its recovery.
Casper’s deeper support discussion includes approximately $68,000, where he identifies potential confluence with an anchored VWAP band. This falls inside the lower range described in the accompanying analysis.
The main Bitcoin price scenarios can be organized as follows:
- Holding $80,500 to $80,600 keeps a recovery toward $86,000 possible.
- Losing that zone puts approximately $78,260 into focus first.
- Further weakness brings $76,000 to $77,000 and $75,000 into consideration.
- A sustained breakdown below $75,000 opens the deeper $66,000 to $75,000 scenario.
These are conditional levels rather than a forecast that every target must be reached. Buyers could interrupt the decline before Bitcoin tests the lowest area.
Read Also: Is Kaspa Really Dead? This Network Data Says Otherwise
Casper’s Broader Bitcoin Outlook Still Allows A Higher Low
Casper’s caution does not amount to a claim that Bitcoin must enter a prolonged bear market. His broader interpretation allows a substantial pullback to produce a higher low within an uptrend.
He describes bearish weekly signals alongside bullish signals across broader timeframes. His argument is that those conditions can coexist because a market can maintain a larger recovery structure and still undergo a painful correction.
Casper also discusses historical declines that followed the weekly signal he tracks. Those comparisons explain his caution, although they do not establish how far the next decline would travel.
His framework leaves room for a bounce near support, another failed recovery, or a deeper pullback before buyers regain control. A higher low remains his preferred broader possibility, but the immediate downside risk remains part of that outlook.
Crypto Millie Watches For Strength Near The 50 Week Average
Crypto Millie offers a more constructive interpretation of the correction in the supplied transcript. The analyst describes the weakness as related to leverage and continues to favor the broader crypto outlook.
That remains Millie’s assessment, and the transcript alone does not prove the cause of the selloff. More directly relevant to the bottom discussion is the emphasis on price strength near the 50 week moving average.
Millie describes waiting for a clearer reaction around that average before becoming more aggressive. This reinforces the importance of how Bitcoin responds at support rather than simply whether it reaches a familiar level.
Subscribe to our YouTube channel for daily crypto updates, market insights, and expert analysis.