XRP price is still holding the upper part of its support structure, but analyst More Crypto Online says the $1.20 area is becoming the next important level to watch.
“XRP is still holding upper support for now. The $1.20 level is the next key support level in this pullback,” the analyst wrote.
The daily Bitstamp chart shows XRP trading around $1.29 and pulling back from its recent recovery high near the mid-$1.50s.
What the Analyst’s XRP Chart Shows
The chart marks a series of Fibonacci retracement levels below current price.
Those levels are approximately:
- 38.2% at $1.3788
- 50% at $1.2929
- 61.8% at $1.2123
- 78.6% at $1.1062
XRP is therefore trading almost directly around the 50% retracement.
More Crypto Online specifically identifies the $1.20 area as the next key support during the pullback. That level closely matches the 61.8% Fibonacci retracement around $1.21 shown on the chart.
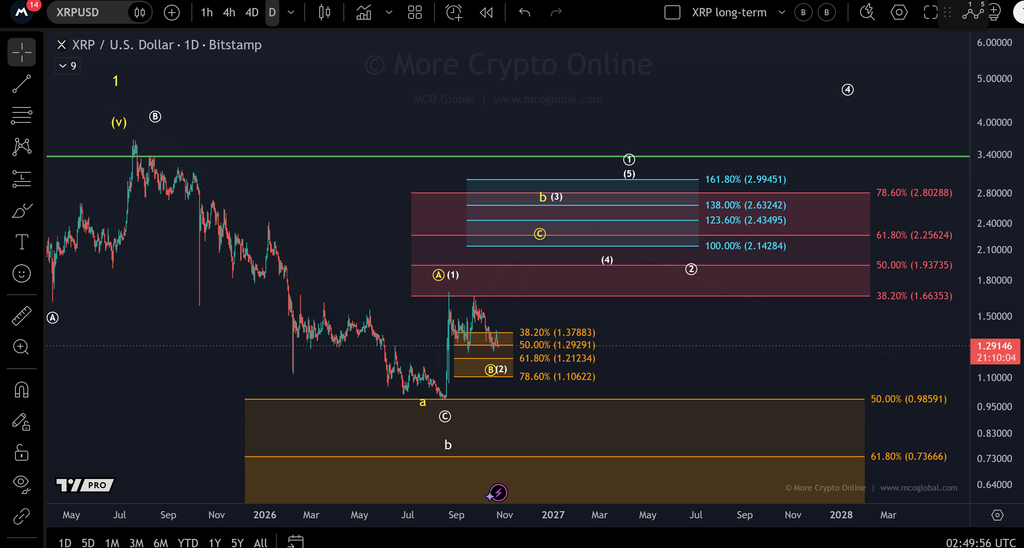
The chart also contains a much deeper support region around $0.99, with another long-term retracement level near $0.74.
On the upside, the analyst maps several larger Fibonacci levels, including roughly $1.66, $1.94, $2.14, $2.26, $2.43, $2.63 and $2.80-$3.00.
Those are levels displayed on the analyst’s chart. They should not be interpreted as confirmed sequential price targets.
Read also: XRP Price Forecasted to Reach (Only) $1.80 This Year: Kalshi Traders
My XRP Price Analysis
My interpretation is that the $1.20-$1.21 region is the most important short-term area because it combines the analyst’s stated support with the 61.8% Fibonacci level visible on the chart.
If XRP holds that zone, I would first watch for a recovery toward $1.38.
A move back above $1.38 would improve the short-term structure and could reopen $1.50-$1.66.
If XRP eventually breaks above approximately $1.66, the larger recovery levels shown on the analyst’s chart would become more relevant.
The bearish scenario would begin with a clear loss of $1.20.
In that case, I would watch approximately $1.10 next. If selling continues beyond that area, the deeper region around $0.99 becomes more relevant.
My short-term XRP price outlook is therefore:
| Scenario | My XRP price outlook |
|---|---|
| Bullish | Hold $1.20-$1.21 → reclaim $1.38 → $1.50-$1.66 |
| Neutral | Consolidation between roughly $1.20 and $1.38 |
| Bearish | Lose $1.20 → around $1.10, with $0.99 as deeper support |
The important distinction is that More Crypto Online is identifying $1.20 as the next key support and displaying the wider Fibonacci structure.
The projected path from $1.20 toward $1.38, $1.50 and $1.66 is my interpretation of what could happen if that support holds.
For now, the analyst’s bullish structure has not been invalidated, but XRP is moving closer to the level that could decide whether the pullback remains controlled or develops into something deeper.
For more crypto news and price predictions, click here.
Subscribe to our YouTube channel for daily crypto updates, market insights, and expert analysis.