XRP price is still above $1.00, but it is facing a brutal bear market like most other altcoins. The token has been range-bound for weeks, struggling to break above $1.17 while defending $1.08 support.
You know how the XRP community is. There are a lot of positive XRP price predictions lying around on X. Just today, I saw a few people saying that XRP price will hit $3 in 2026 and even $7.
To be honest, I know this is possible. XRP did a 7x in less than two years. But in this sentiment? I think we are far from that.
Our team at CaptainAltcoin covers XRP price analysis on a daily basis, and we are very accurate. But today, I decided to have a thorough look at the XRP chart.
What you'll learn 👉
Why Everyone Is Talking About $3 XRP
$3 is around XRP’s all-time high. It is logical for the community to wonder whether it is possible to hit this level again. XRP reached $3.84 in 2018 and traded above $3.30 in 2021. The token has been there before.
I do believe we will see $3 again. But likely not in 2026 unless we see the start of the bull run in late 2026. Do not think you will buy XRP today and hit a 3x in a few weeks. That is not how things work during summer times in crypto and especially during bear markets.
The path to $3 is long. It requires a break above $1.17, then $1.28, then $1.50, then $2.00, and only then $3. Each of those levels will be contested by sellers. The market is not giving away free money.
Real XRP Chart Analysis
The XRP chart tells a story of three phases.
Phase 1: Bearish Trend
The left side of the XRP chart shows lower highs and lower lows with heavy selling pressure. This established the bearish market structure that has dominated XRP since the 2025 highs.
Phase 2: Relief Rally
Around the middle of the chart, XRP exploded upward, broke previous swing highs, and reached approximately $1.28. However, buyers could not hold above resistance. Price immediately retraced. This created a bull trap and distribution area, where early buyers got trapped.
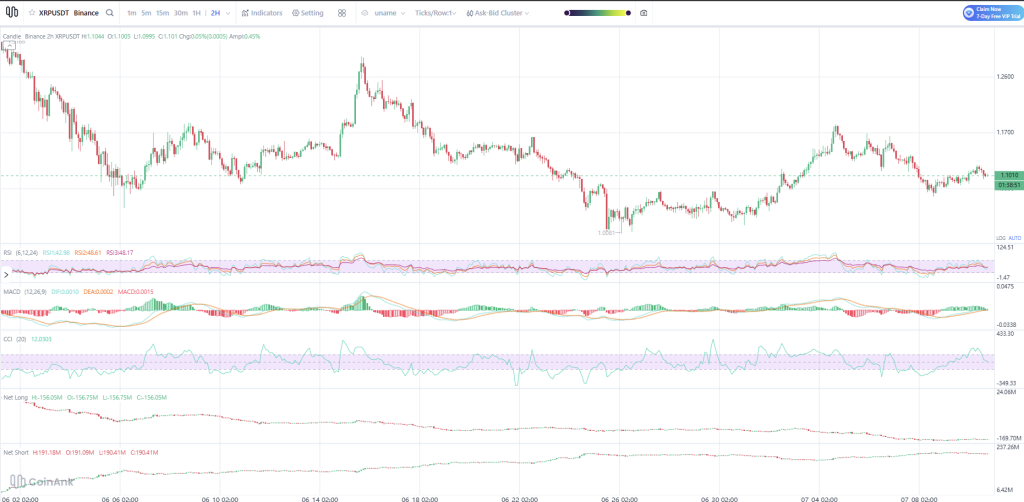
Phase 3: Range
The last third of the chart shows price moving sideways between roughly $1.08 and $1.17. There is no strong trend. Price has been repeatedly rejected from the highs and repeatedly bought from the lows. This is classic accumulation and consolidation.
Currently, price is sitting almost exactly in the middle of that range.
Market Structure
Short-term is neutral. Medium-term is slightly bullish because price has stopped making lower lows. Long-term still needs to break higher highs.
Read also: How Much XRP Tokens Do You Need to Become Rich?
The Key Levels to Watch Before XRP Goes Anywhere Near $3
Support Zones
- Major Support – Zone 1: $1.08–$1.09. This level has been defended several times. Very important. If this breaks, momentum likely shifts bearish.
- Zone 2: $1.04–$1.05. Previous swing support. Expect buyers to appear here.
- Major Swing Low: Around $1.008. This is the strongest support visible. If price reaches this area, expect high volatility.
Resistance Zones
- Resistance 1: $1.12–$1.13. Current local resistance. Price has struggled here several times.
- Resistance 2: $1.16–$1.17. Very strong. Several failed rallies occurred here. Needs heavy volume to break.
- Major Resistance: $1.25–$1.28. Largest supply zone on the chart. If XRP reaches here again, expect significant selling unless momentum is exceptionally strong.
XRP’s Momentum and Market Positioning
RSI Analysis: Current fast RSI is approximately 43, medium RSI is 49, and slow RSI is 48. No overbought or oversold condition. RSI is hovering around 50, indicating neutral momentum. A move above 55–60 would signal strengthening bullish momentum. A drop below 40 would likely signal another bearish leg.
MACD Analysis: The histogram is slightly green, and the MACD line is just above the signal line. This suggests small bullish momentum. However, the histogram is tiny, meaning momentum is weak. This is not a strong trend signal. For a meaningful rally, we would want to see a widening green histogram, MACD crossing strongly upward, and increasing separation.
CCI Analysis: CCI is currently around +12, near zero. No momentum extreme. The market is balanced.
| Indicator | Reading | Interpretation |
|---|---|---|
| Price | Sideways | Neutral |
| RSI | ~48 | Neutral |
| MACD | Slight Bullish Cross | Weak bullish momentum |
| CCI | +12 | Neutral |
| Net Longs | Declining | Bulls cautious |
| Net Shorts | Increasing | Bears gaining confidence |
Net Longs vs Net Shorts: This is actually one of the most interesting parts. The net long line has been trending downward, meaning long positions are decreasing. Traders have been reducing bullish exposure. Net shorts have gradually increased. Short interest is rising. That suggests the market is leaning bearish, which could set up a short squeeze if buyers step in.
My Current XRP Price Predictions
I will try to be as realistic as possible with my current XRP price outlook:
Bullish Scenario (40%)
Requirements: hold above $1.08, break $1.12, strong volume, MACD expands upward, RSI above 55. Targets: $1.13, then $1.17, then $1.22, then $1.27. A breakout above $1.17 would be the first confirmation that buyers are regaining control.
Neutral Scenario (35%)
Most likely in the immediate term. Price continues ranging between $1.08 and $1.17. This could continue until a major catalyst, such as Clarity Act news. Swing traders generally benefit most from this environment by buying near support and taking profits near resistance, rather than chasing moves in the middle of the range.
Bearish Scenario (25%)
Trigger: lose $1.08. Then $1.05, then $1.02, then $1.00 psychological level, then $0.98. If $1.00 fails, the broader trend would become significantly more bearish.
Subscribe to our YouTube channel for daily crypto updates, market insights, and expert analysis.