
XRP has spent the past several weeks doing something that frustrates both bulls and bears: moving sideways after a strong sell-off.
The volatility that decided earlier price action has faded, but that doesn’t mean the market is quiet. In fact, this may be one of the most important technical moments XRP has faced this year.
Trading around $1.09, XRP is sitting directly on a major Fibonacci retracement level while momentum indicators begin to cool from recent highs.
According to crypto analyst CasiTrades, whose technical analysis is frequently featured by CaptainAltcoin, this isn’t just another support test.
What you'll learn 👉
The .786 Retracement Explained
Most crypto traders know about the 0.382, 0.5, and 0.618 Fibonacci retracement levels. Far fewer appreciate why the 0.786 retracement often becomes the most important line during volatile markets.
Unlike shallower retracement levels, the 0.786 Fibonacci is an extremely deep correction. By the time price reaches this level, bullish sentiment has usually weakened considerably.
Many traders assume the trend has already reversed. This is exactly why this area often produces major turning points. Think of the .786 level as the market’s final examination.
🎯 The Levels I've Been Talking About for Months! 🎯
— CasiTrades 🔥 (@CasiTrades) July 8, 2026
ripple:native has come right back down to test the major .786 retracement at $1.09 (Coinbase).
As I've said repeatedly, this is a major macro level. Markets don't just touch levels like this once and immediately move on.… pic.twitter.com/VS8KSmVZHU
If buyers successfully defend it, the correction frequently ends and a new wave begins. If the level breaks decisively, the market often seeks much lower liquidity before finding sustainable demand.
That is exactly where XRP currently sits. As visible on CasiTrades’ 4-hour chart, XRP is testing the 0.786 retracement near $1.085**, with price trading around **$1.08-$1.09.
The green support zone has repeatedly seen buyers over recent sessions, but each bounce has become progressively weaker.
The chart also shows several converging trend lines pointing toward the same support cluster. When multiple technical signals overlap, traders generally pay closer attention because those areas tend to produce stronger reactions.
This makes $1.085-$1.09 far more than just another support level. It is the level that separates a healthy pullback from the possibility of another leg lower.
$1.09 or $0.87 — Here’s the Brutal Truth About Where XRP Goes Next
The technical picture currently shows two realistic scenarios.
Bullish Scenario: $1.09 Holds
If buyers successfully defend the $1.085-$1.09 region, XRP could begin rebuilding a bullish outlook.
The first challenge would be reclaiming recent swing highs around $1.18-$1.20, followed by stronger resistance near $1.35-$1.40.
Beyond that, CasiTrades identifies several higher Fibonacci targets.
The chart shows resistance around:
- $1.53 (0.65 retracement)
- $1.64 (0.618 extension zone)
- $1.80 and beyond if a larger impulse develops
These aren’t short-term guarantees. Rather, they show logical technical objectives if buyers regain control and overall crypto market sentiment improves.
Importantly, any sustained recovery would likely require Bitcoin to remain stable and overall risk appetite across crypto markets to strengthen.
Bearish Scenario: Support Finally Gives Way
The downside scenario is equally possible. If XRP loses the $1.085** support with convincing volume, the next meaningful support doesn’t appear until roughly **$0.87-$0.85.
This area stands out for several reasons:
- Previous demand zone
- Multiple Fibonacci confluences
- Long-term support visible across higher timeframes
- Trendline intersection highlighted by CasiTrades
A move into this region would likely cause another round of bearish sentiment across social media, even though technically it could be the stronger long-term buying opportunity.
Read also: “Could XRP and XLM Replace Bitcoin? Catherine Austin Fitts Makes a Bold Prediction”
XRP Chart: While Everyone Was Calling Bottoms, But…
One of the most interesting aspects of XRP’s recent price action is how often market participants declared the correction finished.
Every bounce brought in new hope. Every small recovery was labelled the beginning of the next bull run. Yet price consistently failed to create higher highs. The 4-hour chart tells this story clearly.
After failing near $1.50, XRP entered a series of lower highs while respecting descending resistance lines. Multiple trendlines continued rejecting rallies and show that the sellers remained in control despite repeated attempts by buyers.
Eventually, price broke beneath those trendlines and moved toward the current support zone around $1.085.
This wasn’t random volatility. It was a textbook example of dropping market structure.
Several technical observations stand out:
Descending Trend Structure
The red and green descending trendlines consistently capped upside attempts throughout the correction.
Instead of producing a clean reversal, each rally lost momentum sooner than the previous one. That usually shows distribution rather than accumulation.
Fibonacci Confluence
Current price isn’t bouncing from arbitrary support. It sits directly inside overlapping Fibonacci retracement levels. This makes the area statistically more important than ordinary horizontal support.
Professional traders often focus on these confluence zones because multiple independent technical methods identify the same price area.
RSI Momentum
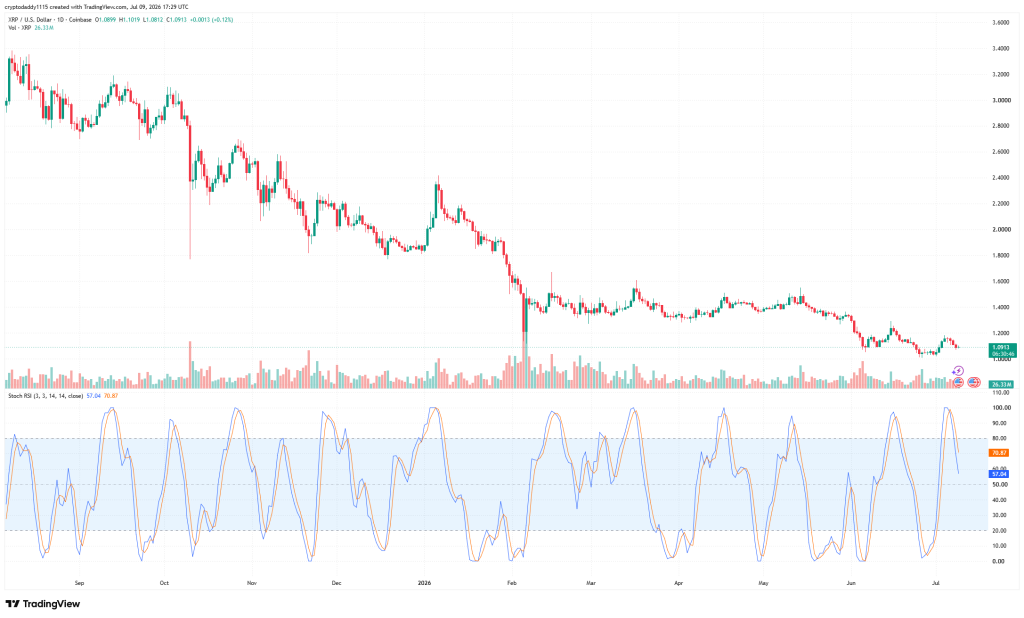
The RSI shown beneath the chart has cooled after becoming overbought during the latest recovery.
Rather than remaining above 60, momentum has slipped back toward the mid-40s.
This suggests bullish momentum has weakened without yet entering extreme oversold territory. In other words, there is still room for either direction.
Daily Oscillators
The daily chart gives additional context. The Ultimate Oscillator remains around 55 and shows neutral momentum rather than excessive optimism or panic.
Meanwhile, the Stochastic RSI has recently rolled over from overbought territory, with the fast line crossing below the slower signal line.
That crossover often shows short-term momentum is fading. However, it doesn’t necessarily invalidate the broader trend. Instead, it suggests buyers still need stronger confirmation before claiming a stable reversal.
Price Compression
Perhaps the most important takeaway is that volatility has contracted. Large directional moves have become smaller. Price is compressing near support.
Markets rarely remain compressed indefinitely. Eventually, buyers or sellers win the battle, and the resulting breakout often becomes notable.
XRP News
While technicals currently lead XRP’s short-term outlook, fundamentals continue to provide important background support.
Ripple continues to expand its enterprise payment infrastructure and cross-border settlement initiatives. At the same time, it maintains relationships with financial institutions looking into blockchain-based payments.
Regulatory clarity surrounding XRP has also improved compared to previous years. This reduces one of the largest uncertainties that weighed on institutional participation.
Meanwhile, the overall crypto sentiment remains closely tied to macroeconomic conditions and Bitcoin’s performance. Spot ETF flows, expectations around interest rates, and institutional capital entering digital assets continue influencing altcoins, including XRP.
For now, none of these developments have been strong enough to override XRP’s immediate technical situation.
Our Take: Is This the Capitulation Moment XRP Needed Before the Real Move?
There is a tendency in crypto markets to assume every correction is either the beginning of a collapse or the start of a rally.
XRP currently appears to be in the final stages of a technical decision rather than a confirmed trend reversal.
The $1.085-$1.09 region remains the most important level on the chart. As long as buyers defend it, the probability of rebuilding toward $1.20**, **$1.35, and eventually the $1.50-$1.65 resistance cluster remains intact.
However, traders should not ignore the downside risk. A clean break below this support would change attention toward the $0.87-$0.85 demand zone.
Instead of chasing every small bounce or panicking during every red candle, traders should watch how price reacts around $1.09.
Frequently Asked Questions
Subscribe to our YouTube channel for daily crypto updates, market insights, and expert analysis.