Crypto prices have spent the past few days moving inside tight ranges instead of making decisive moves. That type of price action often looks uneventful at first glance, although it usually marks the point where the market prepares for its next move. Solana, XRP, and Cardano are all trading near important technical levels. Those levels could determine whether buyers regain control or sellers push prices lower during the next trading sessions.
A closer look at the charts shows each coin has its own story. Solana continues to defend support despite limited momentum. XRP remains trapped inside a narrow range after several quiet sessions. Cardano has held onto recent gains, although fresh buying pressure now faces an important test.
Here is what the latest charts and technical indicators reveal for Solana, XRP, and Cardano price today.
What you'll learn 👉
Solana Price Continues Moving Inside a Narrow Trading Range
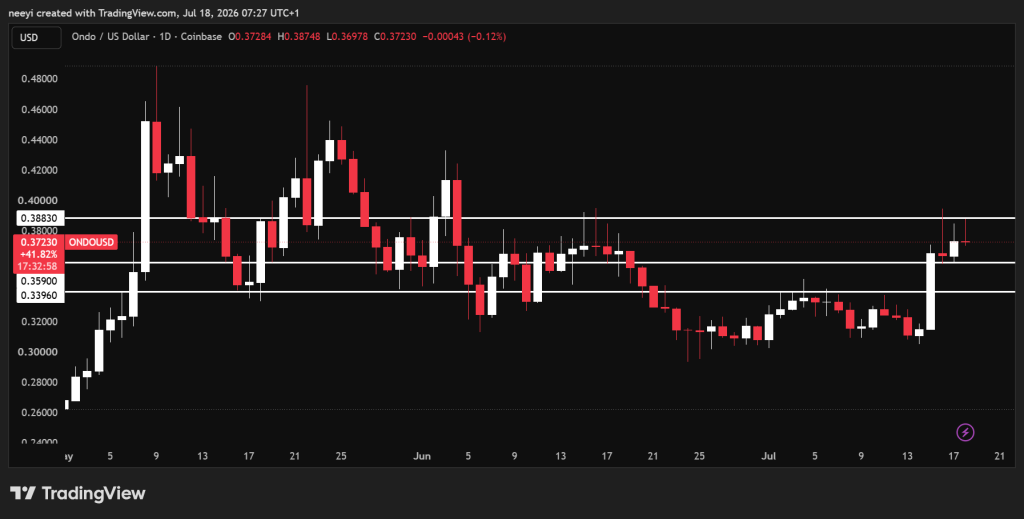
Solana price has traded sideways during the past several days. SOL price has remained between $0.359 and $0.37, which shows neither buyers nor sellers have managed to establish full control.
This type of consolidation can continue if market momentum stays unchanged. Price often remains inside these ranges until a major catalyst creates enough buying or selling pressure to force a breakout.
A move below $0.359 would weaken the current structure. That could open the door for a decline toward $0.339 if selling pressure increases.
A move above $0.388 would produce a more constructive picture. That breakout could allow SOL price to climb toward the $0.41 area if buyers maintain control.
Current technical indicators present a mildly positive picture.
The Relative Strength Index stands at 59.827 with a Buy signal. That reading shows buying strength currently outweighs selling pressure without placing the market inside overbought territory.
The Stochastic Oscillator reads 57.063 and also gives a Buy signal. This points to improving short term momentum after several sessions of sideways trading.
MACD currently reads 0.013 with another Buy signal. Positive MACD values usually indicate bullish momentum remains present, although stronger price movement would provide additional confirmation.
The Ultimate Oscillator stands at 52.726 and also produces a Buy signal. This indicator combines several timeframes and points to steady buying activity across the market.
Solana (SOL) Price Prediction for Today
Bullish scenario: A move above $0.388 could push SOL price toward $0.41 if buying pressure increases.
Neutral scenario: Solana continues trading between $0.359 and $0.37 as buyers and sellers remain balanced.
Bearish scenario: A break below $0.359 could send SOL price toward the next support near $0.339.
XRP Price Remains Stuck Inside a Tight Range
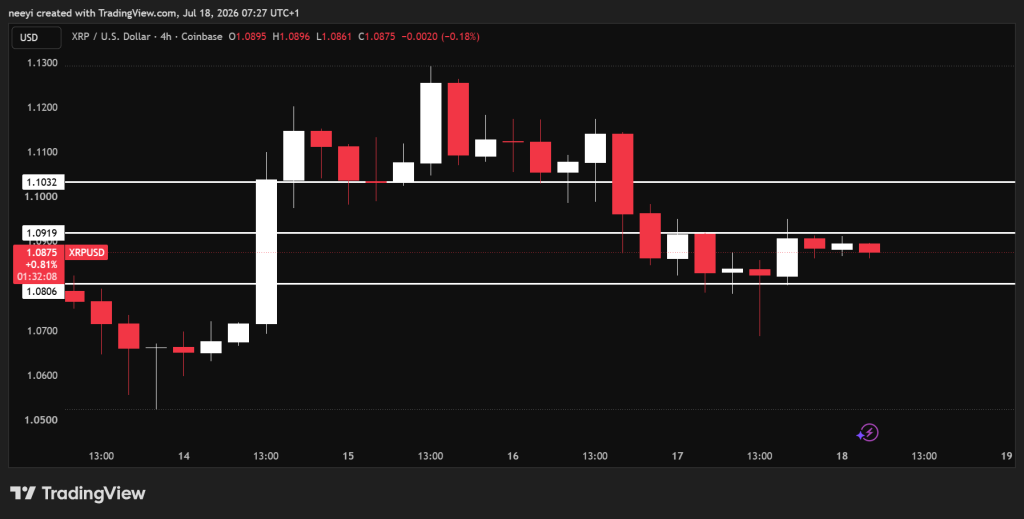
XRP price has also spent the past 2 days moving inside an extremely narrow range. Price has traded between $1.08 and $1.09 without establishing a clear direction.
Such narrow price movement often shows the market is waiting for fresh momentum before making its next move.
Support near $1.08 remains important. A break below that level could weaken XRP price and allow a decline toward $1.071.
Resistance around $1.09 continues limiting upside. A successful breakout above that level could allow XRP price to move above $1.10.
Current technical indicators lean slightly toward caution.
The Relative Strength Index stands at 45.371 with a Neutral reading. This shows neither buyers nor sellers currently hold a strong advantage.
The Stochastic Oscillator reads 31.094 with a Sell signal. Momentum has weakened during the recent consolidation period.
MACD currently stands at -0.004 and also produces a Sell signal. Negative MACD values usually indicate bearish momentum remains slightly stronger than bullish momentum.
The Ultimate Oscillator reads 48.023 and gives another Sell signal. That reading suggests buying pressure remains limited across multiple timeframes.
XRP Price Prediction for Today
Bullish scenario: A move above $1.09 could lift XRP price beyond $1.10 if buyers return.
Neutral scenario: XRP continues trading between $1.08 and $1.09 until stronger momentum develops.
Bearish scenario: A break below $1.08 could send XRP price toward $1.071.
Cardano Price Still Holds Recent Strength Despite a Small Pullback
Cardano price has shown stronger performance than several major cryptocurrencies during recent trading sessions. ADA price finished the previous 5 4-hour candles in positive territory before the current 4-hour candle turned lower.
That small pullback does not automatically change the broader picture. Buyers continue defending most of the recent gains.
ADA price currently trades just below the $0.168 level. A breakout above that resistance could allow Cardano price to climb toward $0.171.
Support near $0.166 remains equally important. A break below that level could allow ADA price to decline toward $0.163.
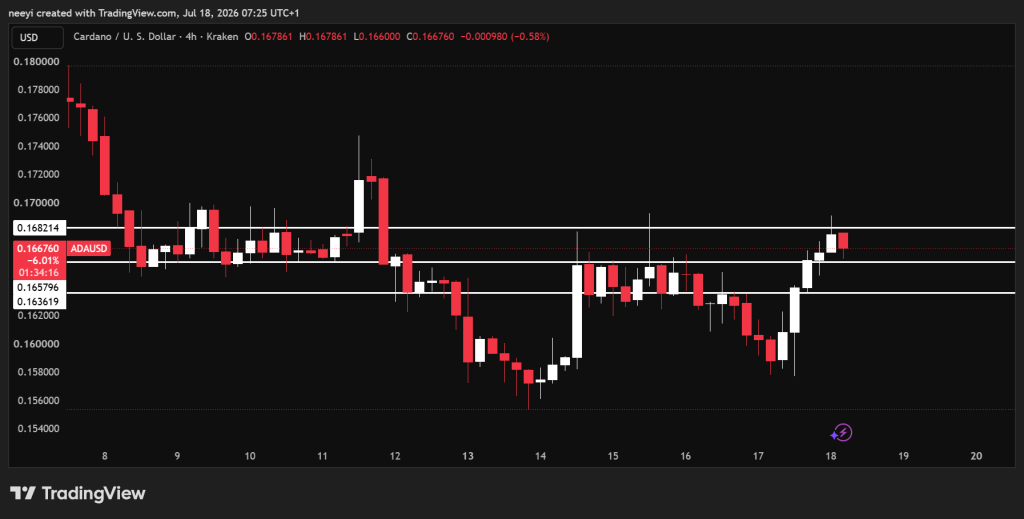
Technical indicators continue showing mixed but generally constructive signals.
The Relative Strength Index stands at 56.094 with a Buy signal. That reading points to healthy buying pressure without placing ADA inside overbought conditions.
The Stochastic Oscillator reads 52.523 and produces a Neutral signal. Short term momentum currently remains balanced after the recent advance.
MACD stands at 0 with a Neutral reading. This shows bullish and bearish momentum remain almost perfectly balanced.
The Ultimate Oscillator reads 53.28 with a Buy signal. Multi timeframe buying pressure remains slightly stronger than selling pressure.
Read Also: Bitcoin Price News: BTC Dips Below $64K, But On-Chain Signals Flash Bottom
Cardano (ADA) Price Prediction for Today
Bullish scenario: A move above $0.168 could allow ADA price to climb toward $0.171.
Neutral scenario: Cardano continues trading between $0.166 and $0.168 as buyers defend recent gains.
Bearish scenario: A break below $0.166 could push ADA price toward $0.163.
FAQs
Subscribe to our YouTube channel for daily crypto updates, market insights, and expert analysis.