
Bitcoin closed this week above $65,000, which could be a positive sign as we go into Monday. The BTC price is up roughly 3% over the past seven days, recovering from the August 1 capitulation low near $62,235.
The weekly close above $65,000 is the first time BTC has finished a week above this level since late July. The recovery has been slow but steady, with higher lows forming after the heavy flush earlier this month.
What you'll learn 👉
Bitcoin Chart Analysis: Recovery from Capitulation
The daily chart tells a story of a market that capitulated, recovered, and is now testing a critical pivot zone.
BTC Price Action – Structure by Phase
Bitcoin rallied pretty strongly to a local high around $66,300–$66,400 in mid‑July, tagging the top of the visible range before rejecting hard with heavy red candles. A choppy top formation followed between $65,000 and $66,300, with multiple failed pushes higher – classic distribution before the drop.
The first leg down broke below $65,000, taking price to roughly $64,300. A relief bounce back to $65,700 failed, rolling over into the biggest drop on the chart: a fast capitulation leg from roughly $65,600 down to $63,700 in a handful of candles.
After a choppy consolidation between $63,600 and $64,400, another push higher to $64,900 failed, leading to the major flush on August 1 , where the Bitcoin price broke down decisively to the chart’s swing low at $62,235.20 – the deepest point of the entire move.
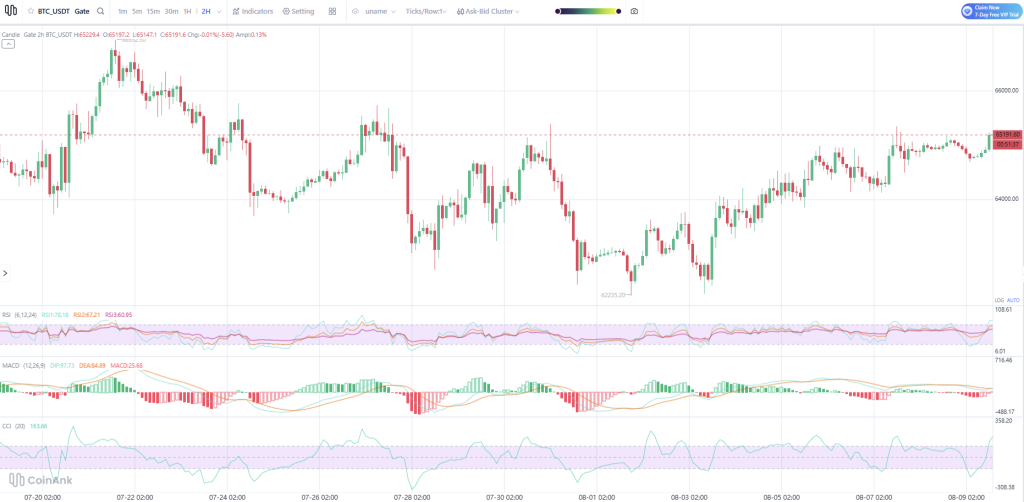
A sharp V‑shaped recovery followed, rallying back to roughly $65,000 before pulling back to retest the $63,000–$63,700 zone. From there, a slower, more constructive grind from roughly $63,000 back up through $64,000–$65,000 formed, with higher lows creating a healthier structure than the earlier V‑moves.
Current leg: Price pushed above $65,000 resistance, tagged a local high near $65,500, and is now consolidating tightly around $65,100–$65,300 , sitting right at the top of its recent range.
Read also: Bitcoin ETFs Clock Best Week in Flows Since April
Support & Resistance Zones:
| Level | Type | Notes |
|---|---|---|
| $66,300–$66,400 | Major resistance | Origin of the chart’s high; untested since rejection |
| $65,500–$65,700 | Resistance | Rejected multiple times |
| $65,000 | Pivot / psychological | Flipping between support/resistance – key level to watch |
| $64,000–$64,300 | Support | Held as a floor multiple times |
| $63,000–$63,700 | Support | Retest zone after flush – now a demand area |
| $62,235.20 | Major support | Swing low / capitulation wick |
Price is currently pressing directly against the $65,000–$65,500 pivot zone. This is the single most important near‑term level on the chart.
Indicators:
RSI (6, 12, 24): RSI1 sits at 79.31 (overbought), RSI2 at 67.65 (approaching overbought), and RSI3 at 61.11 (neutral‑to‑bullish). The spread between fast and slow RSI lines shows short‑term momentum has accelerated faster than the underlying trend – often a sign of short‑term overextension after the recent push above $65,000.
MACD (12, 26, 9): DIF (98.17) sits above DEA (84.98), with a positive histogram (26.38). Bullish momentum is active, but the current green bars are modest compared to the deep red bars during the July selloff. This is more of a steady grind than a powerful impulse.
CCI (20): Currently at 168.23, above the +100 threshold – confirming strong short‑term uptrend and overbought conditions. CCI has been oscillatory throughout this period, prone to fast round‑trips rather than sustained overbought runs.
Synthesis: Bitcoin fell from ~$66,400 to a low of $62,235 over about 10 days, then staged a multi‑stage recovery back to test the $65,000–$65,500 pivot. Price is now sitting at that pivot with short‑term RSI and CCI flagging overbought conditions, while MACD confirms the uptrend is intact but not accelerating aggressively.
The combination of price at resistance, short‑term overbought, and moderate MACD strength typically points to one of two near‑term paths: a stall and pullback toward $64,000 support to reset short‑term oscillators before another leg up, or a breakout above $65,500–$66,300 if buying pressure sustains through the current resistance cluster.
The $65,000 level is the fulcrum. Holding above it keeps the recovery structure (higher lows) intact. Losing it re‑opens the $63,000–$64,000 zone.
Bitcoin News: Saylor, Strategy, and the Clarity Act
Michael Saylor revealed on August 6 that Strategy used ChatGPT to design a new class of variable‑rate preferred stock. The AI‑assisted financial engineering enabled the firm to raise approximately $15 billion in 2025‑2026 specifically for its Bitcoin acquisition strategy, overcoming traditional financing limits.
On August 9, Saylor posted Strategy’s iconic orange‑dot Bitcoin acquisition chart on X with the caption “Doing ₿usiness.” The post came days after the company disclosed selling 1,638 BTC in late July and early August for $104.73 million to fund share buybacks and dividends. The post ignited speculation about a potential new treasury purchase.
JUST IN: 🇺🇸 Senate officially fails to pass Crypto Clarity Act before summer recess.
— Watcher.Guru (@WatcherGuru) August 8, 2026
The Senate officially failed to pass the Crypto Clarity Act before the summer recess. The bill now waits until the Senate returns on September 14. With only 51 confirmed votes and 60 needed, the path to passage remains uncertain. The delay extends the regulatory uncertainty that has weighed on the crypto market for months.
Crypto Michael: “We Are on the Cusp of a Major Bullish Breakout”
Analyst Crypto Michael, who claims to have predicted every Bitcoin move in recent months with perfect accuracy, tweeted:
“We are now on the cusp of the major bullish breakout. The rally will extend much further than most expect. Fade me at your own risk!”
I’ve predicted every Bitcoin move in recent months with perfect accuracy.
— Crypto Michael (@MichaelXBT) August 9, 2026
We are now on the cusp of the major bullish breakout.
The rally will extend much further than most expect.
Fade me at your own risk! pic.twitter.com/2BF5pygA6c
His attached chart shows a Head and Shoulders Top pattern with a yellow support line at approximately $65,000. The chart indicate that if Bitcoin breaks this support, a quick flush down could occur before the next leg up. Michael closed half of his Bitcoin short from $75,000 at $60,000 and is now expecting a bounce soon.
The chart also shows an annotation: “Crypto likes to shake out both sides before a major move. The dip before the rip.” This aligns with his view that the current consolidation is a shakeout before a larger move higher.
Bitcoin Price Forecast for Today (August 10)
Bitcoin is trading near $65,100–$65,300 , pressing against the critical pivot zone. The indicators are mixed – short‑term overbought, but the broader recovery structure remains intact.
Bullish Scenario (30%):
If Bitcoin holds above $65,000 and breaks $65,500 with volume, the next targets are $66,300–$66,400 (the July rejection zone) and then $67,000–$68,000. Saylor’s “Doing ₿usiness” post could ignite speculation about a new Strategy purchase, adding a psychological bid. A break above $66,400 would change the structure significantly, opening the path to $70,000.
Realistic Scenario (50%):
Bitcoin consolidates between $64,000 and $65,500 . The overbought RSI and CCI indicate a pause or shallow pullback is likely before any further advance. The market is digesting the Clarity Act delay and waiting for the next catalyst. This is the most probable outcome for today: range‑bound trading with low volume.
Bearish Scenario (20%):
If Bitcoin loses $65,000 , the next support is $64,000–$64,300. A break below $64,000 could trigger a move toward $63,000–$63,700 . This would re‑open the demand zone that held after the August 1 flush. The Clarity Act delay and general regulatory uncertainty could weigh on sentiment if the broader market turns risk‑off.
My take: The $65,000 level is the line in the sand for today. Bitcoin has recovered well from the August 1 low, but the short‑term indicators are stretched. A pause or shallow pullback to $64,000 would be healthy before any attempt to break higher. The bullish case depends on holding $65,000 and breaking $65,500. The bearish case depends on losing $65,000 and revisiting the $63,000–$64,000 zone.
For now, I am watching the $65,000 level. Holding above it keeps the recovery intact. Losing it would change the short‑term bias back to neutral or bearish.
Subscribe to our YouTube channel for daily crypto updates, market insights, and expert analysis.