Solana, XRP, and Dogecoin enter August 5 without a clear market direction. Each cryptocurrency remains inside an established range, although their technical indicators reveal different levels of buying and selling pressure.
Today’s price action may depend on whether buyers or sellers can break the nearest boundaries. Solana has the strongest indicator mix of the 3 assets, XRP faces broader selling pressure, and Dogecoin remains caught between neutral and bearish signals. The key levels below could determine which asset makes the first decisive move.
What you'll learn 👉
Solana Price Remains Trapped Inside a Narrow Short-Term Range
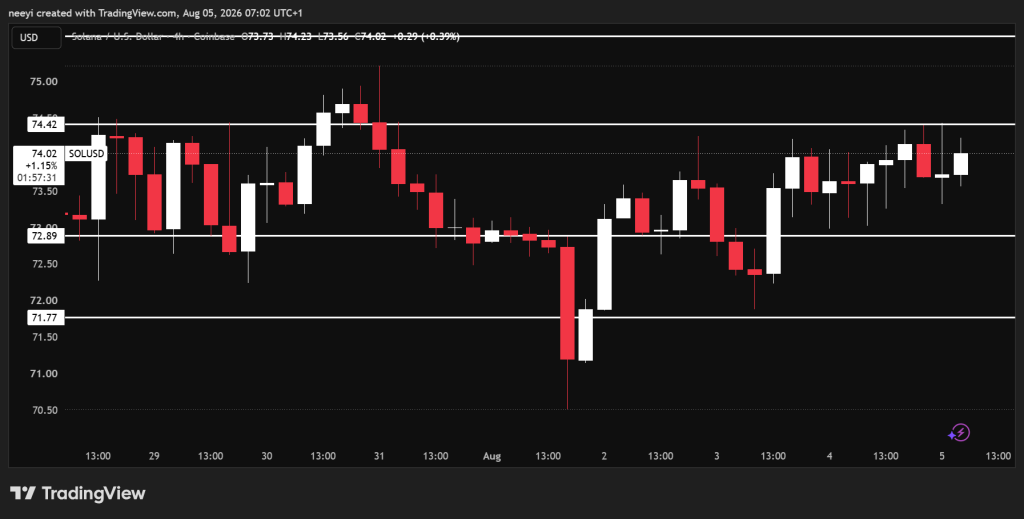
Solana price has appeared choppy since Monday afternoon. SOL has moved sideways between $72.89 and $74.42, and that pattern could continue today without a major market catalyst.
A confirmed break above $74.40 would strengthen the bullish case. Such a move could carry Solana price toward $75.60 during today’s session. Sellers could regain control if SOL loses support near $72.80, which could expose the next downside target around $71.70.
Indicator readings from the Investing.com 5 hour chart present a mildly bullish picture. The RSI stands at 54.349 and remains neutral, which means neither buyers nor sellers have complete control.
The Stochastic indicator gives a buy signal at 71.582. This reading shows stronger short term demand, although SOL is moving closer to the upper part of the indicator’s range.
The MACD value stands at 0.003 and gives another buy signal. Positive MACD territory means bullish pressure has a slight advantage over bearish pressure.
The Ultimate Oscillator provides the only sell signal at 46.517. That reading points to some weakness across multiple time periods and reduces the strength of the bullish outlook.
| Name | Value | Action |
|---|---|---|
| RSI (14) | 54.349 | Neutral |
| STOCH (9,6) | 71.582 | Buy |
| MACD (12,26) | 0.003 | Buy |
| Ultimate Oscillator | 46.517 | Sell |
Solana Price Prediction for Today
- Bullish scenario: Solana price could reach $75.60 after a confirmed break above $74.40.
- Neutral scenario: SOL could remain between $72.89 and $74.42 if neither side controls the market.
- Bearish scenario: Solana price could fall toward $71.70 if support near $72.80 fails.
XRP Price Indicators Favor Sellers Inside the Current Range
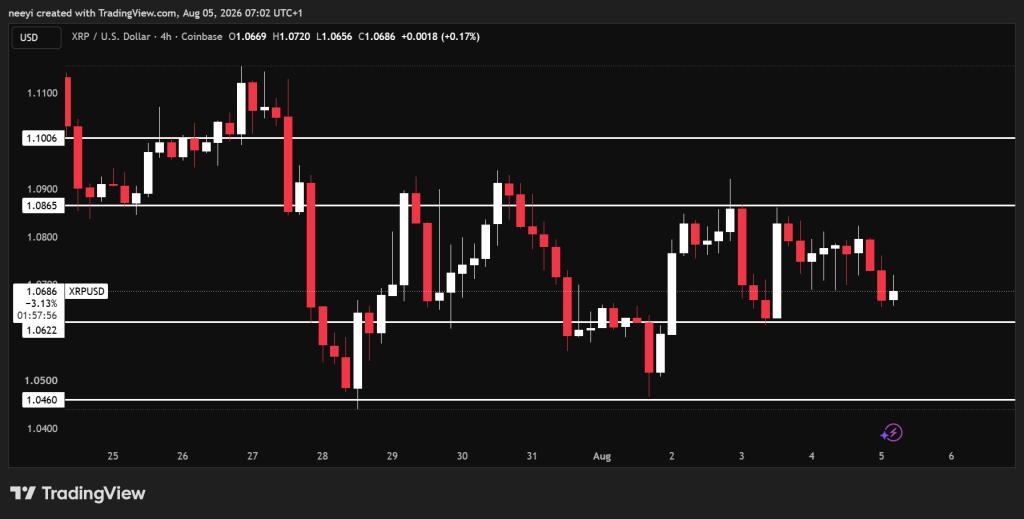
XRP price continued trading yesterday inside the range that began on Sunday. Its main boundaries remain near $1.069 and $1.086, which have contained several recent price moves.
A break below $1.069 could send XRP price toward $1.046. Buyers would need to push XRP above $1.086 to open the path toward $1.10 today.
Indicator readings from the Investing.com 5 hour chart lean bearish. The RSI stands at 46.625 and gives a neutral reading, although its position below 50 reveals limited buying strength.
The Stochastic indicator stands at 32.688 and produces a sell signal. This value points to weak short term demand, although it has not entered deeply oversold territory.
The MACD records a value of negative 0.002 and gives another sell signal. Bearish pressure therefore remains present beneath the current XRP price range.
The Ultimate Oscillator also gives a sell signal at 36.885. This result confirms that sellers currently have the advantage across several measured periods.
| Name | Value | Action |
|---|---|---|
| RSI (14) | 46.625 | Neutral |
| STOCH (9,6) | 32.688 | Sell |
| MACD (12,26) | -0.002 | Sell |
| Ultimate Oscillator | 36.885 | Sell |
XRP Price Prediction for Today
- Bullish scenario: XRP price could test $1.10 after breaking above the $1.086 resistance level.
- Neutral scenario: XRP could continue trading between $1.069 and $1.086 throughout today’s session.
- Bearish scenario: XRP price could drop toward $1.046 if sellers break support at $1.069.
Dogecoin Price Could Extend Its Range Bound Movement Today
Dogecoin price has maintained a wider range for a longer period. DOGE has traded between $0.068 and $0.072 since late July, and that pattern could remain intact unless a major catalyst changes market conditions.
A break above $0.071 could take DOGE price toward $0.073. A confirmed move below $0.068 could expose the lower target around $0.065 today.
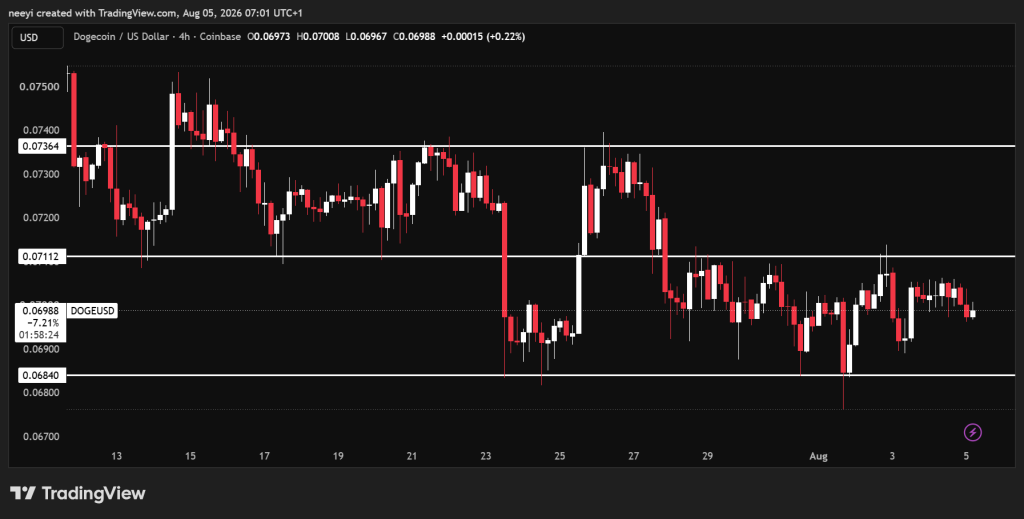
Indicator readings from the Investing.com 5 hour chart show limited directional strength. The RSI stands at 49.378 and remains neutral, which places market control almost evenly between buyers and sellers.
The Stochastic indicator also remains neutral at 52.381. This reading confirms that Dogecoin price currently lacks strong short term pressure in either direction.
The MACD value remains at 0 but carries a sell action. That combination points to weak price direction, with bearish risk still present.
The Ultimate Oscillator stands at 40.736 and gives another sell signal. DOGE therefore needs stronger demand before a convincing bullish move can develop.
| Name | Value | Action |
|---|---|---|
| RSI (14) | 49.378 | Neutral |
| STOCH (9,6) | 52.381 | Neutral |
| MACD (12,26) | 0 | Sell |
| Ultimate Oscillator | 40.736 | Sell |
Dogecoin Price Prediction for Today
- Bullish scenario: Dogecoin price could reach $0.073 after a confirmed break above $0.071.
- Neutral scenario: DOGE could remain between $0.068 and $0.072 if market demand stays unchanged.
- Bearish scenario: Dogecoin price could fall toward $0.065 after losing the $0.068 support level.
FAQs
Subscribe to our YouTube channel for daily crypto updates, market insights, and expert analysis.