Silver has returned to one of the most important price areas on its long-term chart after a steep correction pushed XAG/USD back toward $49.
Market analyst Rashad Hajiyev believes the $47-$48 region could become critical for silver because several long-term support lines are converging around the same area.
Silver is also sitting almost exactly where its famous 2011 rally topped out.
That makes the current move more than another short-term dip.
What you'll learn 👉
Silver Price Returns to Its 2011 High
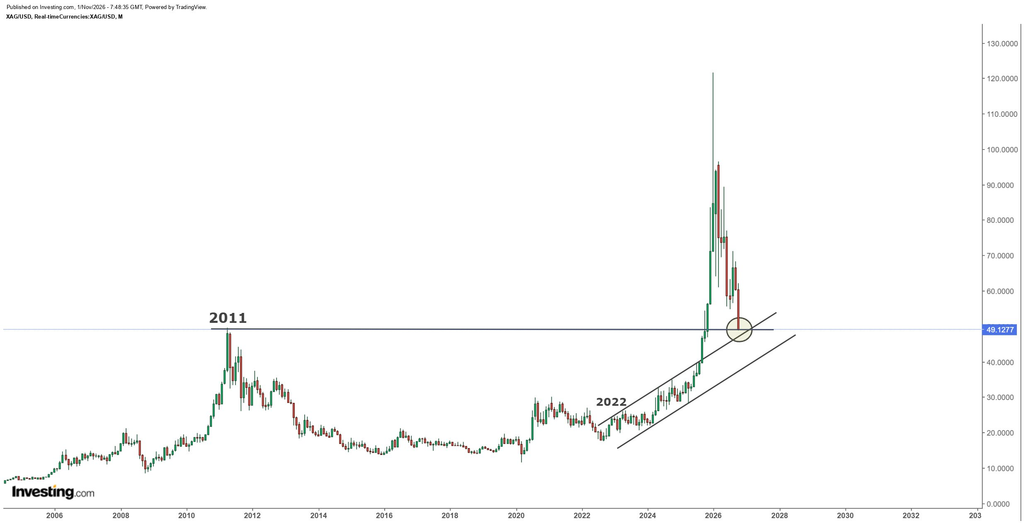
Silver closed around $49.13 after falling more than 6% on October 30, with the session reaching a low near $48.86.
That places XAG/USD almost directly on the historic 2011 peak.
Silver reached approximately $49.81 during April 2011 before entering a long decline that eventually took the metal well below $20.
Hajiyev’s chart shows that this old resistance level now overlaps with the lower part of silver’s broader rising structure.
He wrote that silver is approaching a confluence of support around $47-$48 and argued that the metal needs to hold near current prices if the latest drop is simply a retest of its former breakout area.
This is a classic technical concept.
A resistance level that is finally broken can later become support when price returns to test it from above.
Silver is now testing exactly that theory.
Why the $47-$49 Silver Price Zone Matters
There are effectively three technical factors meeting in the same region.
The first is the 2011 high around $49-$50.
The second is the rising trend line that has guided silver higher from its 2022 lows.
The third is a second longer-term support line sitting slightly below the current price.
That makes approximately $47-$49 a much stronger area than an isolated horizontal support level.
Another technical outlook published on November 1 also identified $49.83 as the 2011 breakout level and $48.87 as immediate support. It noted that silver would need to recover above roughly $54.78 to reduce the current downside pressure.
The interesting part is that silver has reached this area after an enormous 2026 move.
The metal traded as high as roughly $121.65 earlier this year before falling back toward $49, meaning more than half of the peak value has now disappeared.
Read also: Analyst Admits His Silver Price Prediction Was Wrong, Revises Outlook
What Happens If Silver Holds $47-$49?
If Hajiyev is correct and the move is primarily a retest, silver does not necessarily need to immediately return to its highs.
Holding above approximately $47-$49 and building a base would already be constructive.
The first recovery level to watch would be around $52, followed by the $54-$55 area.
A return above $54.78 would be particularly useful because it would reclaim one of the levels lost during the latest decline.
But the downside scenario is equally important.
A decisive break below the $47-$48 confluence would weaken the long-term structure shown on Hajiyev’s chart.
The psychological $45 area could then become the next target, followed by $40 if selling pressure continues.
That means silver is entering November at one of its most interesting technical levels of the year.
The 2011 high spent more than a decade acting as resistance.
Silver bulls now need to prove that the same level can finally work as support.
For more financial news and price predictions, click here.
Subscribe to our YouTube channel for daily crypto updates, market insights, and expert analysis.