AI XRP Price Forecast Turns Bullish As This Indicator Hits Extreme Oversold Levels


XRP’s latest decline has brought its price back toward a support level that has repeatedly interrupted selling since August. Vincent Van Code’s automated analysis now points to an oversold reading that could open the door to a recovery. The question is whether buyers can turn that opportunity into a meaningful bounce.
The bullish part of this AI XRP price forecast comes from an indicator that measures how heavily the token has been sold. Other readings remain bearish, so the recovery case still needs confirmation from price action. XRP’s next move around familiar support could help settle that debate.
What you'll learn 👉
Vincent Van Code’s AI XRP Price Forecast Identifies Extreme Oversold Conditions
Vincent Van Code shared an automated XRP assessment through his Vancode.ai research platform. The supplied snapshot placed XRP price near $1.29, down 0.65% over 24 hours, alongside a volume reading of 38,581,909.
The strongest argument for a bounce came from the Relative Strength Index. XRP’s RSI measured 17.35, well below the commonly used oversold threshold of 30.
That reading shows how heavily recent price action has favored sellers. It can precede a relief rally, although an oversold indicator cannot establish that a bottom has formed. Strong downtrends can keep an asset oversold even after an initial recovery attempt.
Latest AI Summary: XRP ✨ $1.28 ± $0.0300 (60% strength) 📊 Current Token Status Price: $1.29 Volume: 38,581,909 24H Change %: -0.65% Price is in a clear downtrend, having broken below all key EMAs and currently trading near $1.29. RSI is deeply oversold at 17.35, suggesting a potential relief bounce. MACD histogram is negative but decelerating. Recent candles show consistent selling pressure with lower highs and lows. Volume spikes on down moves confirm bearish sentiment. Immediate support at $1.26 and resistance at $1.39. 📈 Trend Strong short-term downtrend. Price has collapsed from recent highs near $1.39 to current levels, breaking decisively below all major moving averages. Candles – Bearish (85%) Recent hourly candles show a series of lower highs and lower lows. The last 24 hours feature long red candles on high volume, confirming persistent selling pressure. EMA – Bearish (90%) Price $1.29 is well below all EMAs (12: $1.31, 20: $1.32, 50: $1.32, 200: $1.31), confirming a strong bearish alignment and significant selling pressure. MACD – Bearish (70%) MACD line is negative at -0.00889 and below its signal line. The histogram is negative but less negative than prior reading, indicating bearish momentum may be slowing. RSI – Bullish (80%) RSI_14 at 17.35 is deeply oversold, far below the 30 threshold. This indicates extreme selling pressure and suggests a high probability of a short-term technical bounce. Volume – Bearish (75%) Volume spikes consistently accompany price declines (e.g., 3.5M+ at 23:00), confirming strong selling interest. Low volume on small up moves suggests weak buying. 🔗 Click for more details https://t.co/ajqL3iSXvj 🎓 https://t.co/JuZJYDY4xL is an educational research tool. All projections are automated model outputs and do not constitute financial advice. Always perform your own independent research.
— Vincent Van Code (@vincent_vancode) October 24, 2026
Van Code’s model assigned its RSI assessment an 80% bullish score. That figure represents the tool’s classification of the indicator, rather than an independently verified 80% probability that XRP price will rise.
The broader automated output centered on $1.28, plus or minus $0.03, with a stated strength of 60%. That range describes a relatively narrow price projection and does not establish a larger bullish reversal.
XRP Price Indicators Still Show Persistent Selling Pressure
The oversold RSI stands against several bearish readings in Van Code’s analysis. XRP price remained below its listed exponential moving averages, which ranged from approximately $1.31 to $1.32.
Those levels create an immediate recovery test. A bounce toward that area would need enough demand to carry XRP back above the averages and prevent another rejection.
The MACD reading remained negative, although its histogram had become less negative than the previous reading. That points to a possible slowdown in bearish pressure, without confirmation that buyers have taken control.
Recent hourly candles also formed lower highs and lower lows. Larger volume accompanied price declines, and smaller recoveries attracted weaker volume in the supplied assessment.
These conditions explain why the bullish XRP price forecast needs careful interpretation. The RSI supports a potential rebound, but the broader evidence still describes a market under selling pressure.
XRP Price Support At $1.26 Has Repeatedly Produced Recoveries
A look at the XRP price structure described in the supplied analysis shows repeated recoveries from around $1.26 since August. Similar bounces appeared in mid September and mid October, which makes the latest return to this area especially relevant.
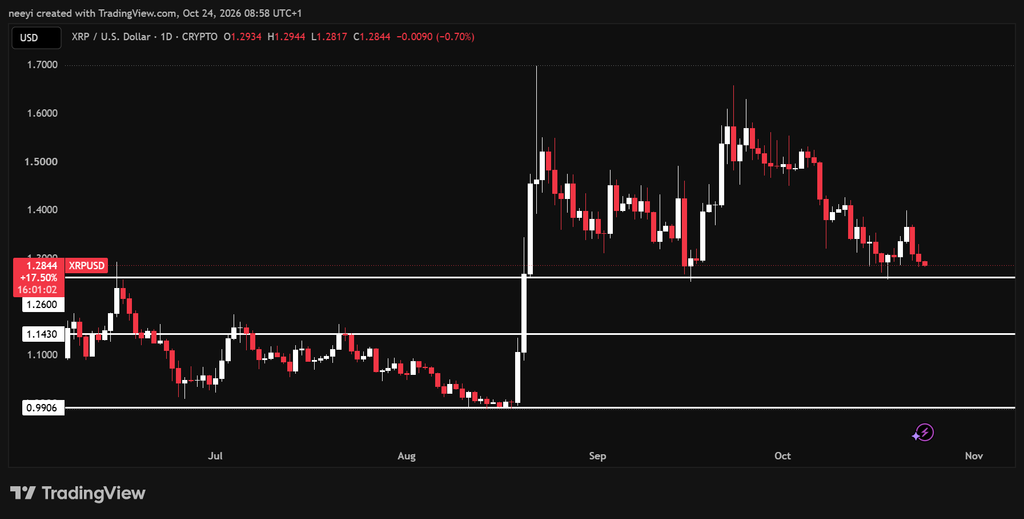
The latest decline could also produce a 3rd consecutive red daily candle. That would bring XRP back toward familiar support after another stretch of weakness.
Repeated defenses give $1.26 a clear role in the recovery scenario. However, previous bounces do not guarantee another successful defense, particularly if sellers continue to press the level.
The main levels in the supplied analysis are:
- $1.26 support: Buyers need to defend this area to preserve the immediate bounce scenario.
- $1.31 to $1.32 resistance: The listed moving averages create an early test for a recovery.
- $1.39 resistance: Van Code identified this level as a further barrier above the current price.
A recovery through these levels would provide stronger evidence than the oversold RSI alone.
Read Also: Gold and Silver Price Predictions for Today (October 24) – Crash Continues?
Losing $1.26 Could Expose XRP Price To Deeper Declines
The bearish scenario becomes more relevant if XRP breaks below $1.26 and fails to recover that level. The supplied price analysis identifies $1.15 to $1.14 as the next potential support zone.
A further breakdown below that area could expose XRP price to $0.99 before the end of the month or early next month. That remains a conditional scenario, not a confirmed destination or a separate forecast from Van Code’s model.
FAQs
Subscribe to our YouTube channel for daily crypto updates, market insights, and expert analysis.