
XRP is once again testing the price level that has protected it through several difficult market periods. ETF demand has weakened, technical indicators remain bearish, and the token recently slipped below $1 for only the second time since November 2024. That combination leaves XRP price facing a test that could decide whether its decline deepens or buyers regain control.
U.S. spot XRP ETFs enjoyed much stronger demand earlier this year. Weekly inflows reached a record $60.5 million during the trading week from May 11 to May 15, 2026.
The products had already attracted $55.71 million during the week ending January 16. Institutional accumulation after the holiday period helped push total XRP ETF assets beyond $1.5 billion.
Demand remained positive during the first week of August, when XRP ETFs recorded $14.86 million in weekly inflows. However, that amount collapsed by 93% to only $1.01 million during the week ending August 8.
ETF FLOWS: US SPOT CRYPTO ETFs FLOWS DATA UPDATE (11-08-2026) YESTERDAY
— Crypto Patel (@CryptoPatel) August 12, 2026
🟩 Bitcoin ETFs: +78 $BTC (+$4.89M)
🟥 Ethereum ETFs: -948 $ETH (-$1.76M)
🟩 SOLANA ETFs: +18.98K $SOL (+$1.43M)
🟩 $XRP, $DOGE, $BNB, $AVAX, $DOT, $LTC, $HYPE, $LINK, $HBAR Flows Was Zero.
TOTAL US SPOT… https://t.co/eGlNxInzYw pic.twitter.com/1OPUdC168y
Daily flow data makes the slowdown harder to ignore. Crypto analyst Crypto Patel reported that XRP ETF flows remained at $0 across the August 7, August 10, and August 11 updates.
Those flat sessions occurred under very different market conditions. Bitcoin and Ethereum ETFs recorded inflows on August 7, followed by heavy outflows during the next update. Bitcoin ETFs then returned to positive territory on August 11, but XRP ETF demand remained at $0 throughout all 3 reports.
That contrast matters because it shows that the weakness cannot be blamed entirely on broader ETF conditions. Capital continued moving through other crypto products, but fresh money entering spot XRP ETFs had nearly stopped.
What you'll learn 👉
XRP Price Has Lost More Than 70% Since Its July 2025 Peak
XRP price has remained under pressure since reaching approximately $3.60 during July 2025. The token has fallen more than 70% from that peak and currently trades near $1.02.
The decline has created a prolonged downtrend with repeated lower price levels. Despite that weakness, buyers have protected one important area remarkably well.
XRP broke above $1 during November 2024 and has traded above that level for most of the period since then. Only 2 brief moves below the psychological support have occurred. The first happened during November 2024, shortly after the original breakout.
The second happened yesterday when XRP price touched approximately $0.99. Buyers responded almost immediately and pushed the token back above $1. XRP now trades near $1.02, but the recovery remains fragile because the wider trend and ETF numbers are still weak.
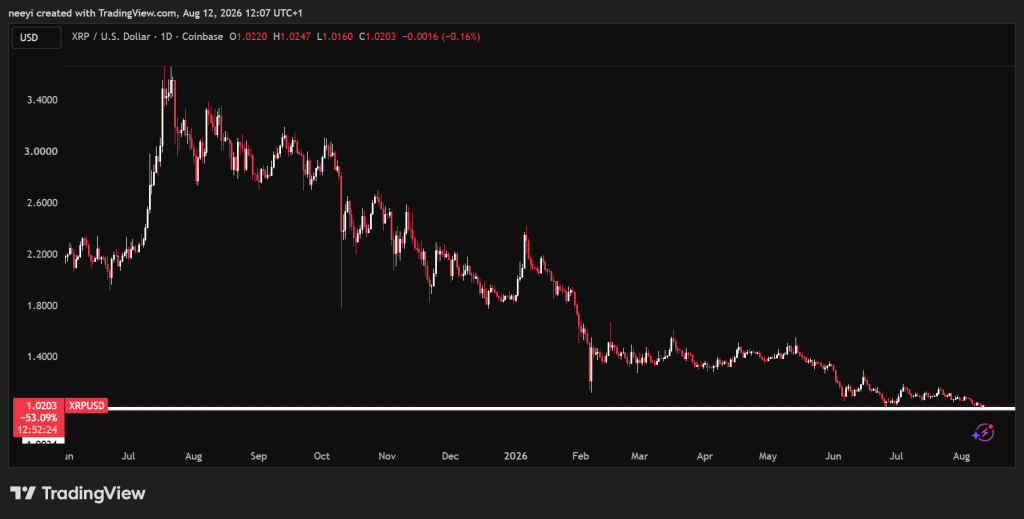
Losing $1 Could Expose XRP Price to Much Lower Support Levels
Another test of $1 may become difficult to defend if ETF demand remains absent. Repeated tests can gradually weaken a support zone because available buy orders are consumed each time the price returns.
A confirmed break below $1 could also carry psychological consequences. XRP has stayed above this mark for almost 2 years, so losing it may increase selling pressure and cause several lower supports to appear quickly.
The main downside levels deserve attention:
- $0.88 could provide the first meaningful support below $1.
- $0.77 could become the next target if selling pressure continues.
- $0.57 represents a deeper support area under a more severe decline.
A short move below $1 would not automatically confirm that every lower target will be reached. XRP would need to remain beneath that level and fail to recover before the bearish case becomes stronger. However, the current downtrend means another breakdown could arrive within days if buyers remain unable to produce a stronger rebound.
Read Also: SUI Buyers Are Returning Fast, but One Major Risk Could Spoil the Setup
Bearish XRP Indicators Show That Sellers Still Control the Trend
A look at the XRP chart shows several indicators pointing toward continued weakness. The 14 period Relative Strength Index stands at 38.469, which remains below the neutral 50 mark. That reading shows weak demand, although XRP has not reached the traditional oversold level below 30.
The Stochastic indicator reads 32.809 and also produces a sell signal. This reading shows that recent closing prices remain near the lower end of their range.
MACD stands at negative 0.017. A negative reading confirms that bearish price strength continues to outweigh bullish pressure.
The Ultimate Oscillator records 41.545, which stays below its neutral midpoint. Bull Bear Power offers another warning at negative 0.0473. That figure shows sellers retaining control over short term price movement.
| Indicator | Value | Action |
|---|---|---|
| RSI (14) | 38.469 | Sell |
| STOCH (9,6) | 32.809 | Sell |
| MACD (12,26) | -0.017 | Sell |
| Ultimate Oscillator | 41.545 | Sell |
| Bull Bear Power (13) | -0.0473 | Sell |
XRP has defended $1 once again, but the latest bounce has not repaired the broader setup. ETF inflows remain close to zero, every listed indicator produces a sell signal, and the token remains trapped inside a major downtrend.
FAQs
Subscribe to our YouTube channel for daily crypto updates, market insights, and expert analysis.