XRP price enters October 17 under renewed selling pressure, trading around $1.306 after falling roughly 2.6% over the past 24 hours.
The token briefly dropped to $1.2921, putting the psychologically important $1.30 level under pressure again. XRP has now erased most of its latest rebound and remains close to the lower end of the range established during this week’s broader crypto selloff.
The latest chart also shows around $555 million in 24-hour trading volume and $5.1 million in liquidations, reflecting continued volatility around the current support area.
What you'll learn 👉
XRP Chart Analysis
I analyzed the XRP/USDT two-hour chart on Binance.
The short-term structure remains bearish. Since trading above $1.50 earlier this month, the XRP price has continued forming lower highs and lower lows.
The immediate support zone is $1.29-$1.30. Buyers have already reacted there several times, making it the first level that needs to survive on October 17.
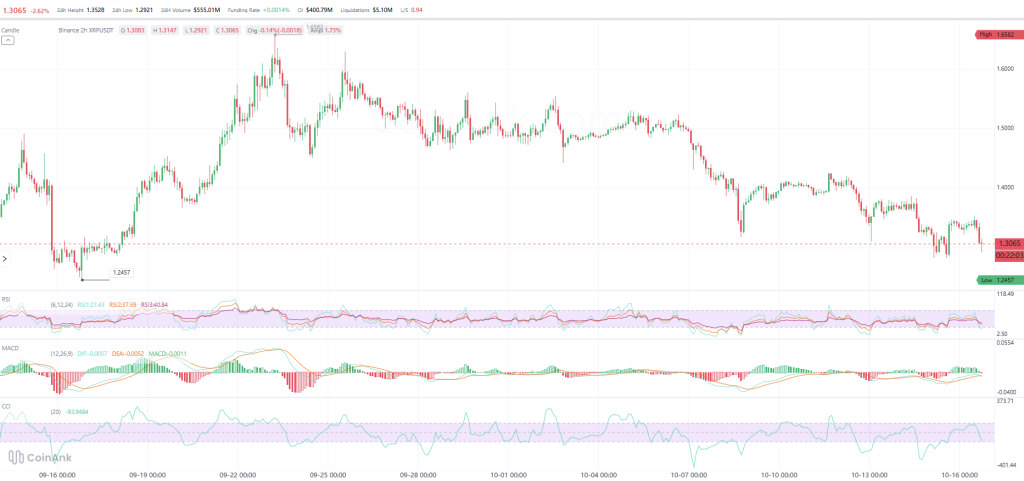
A break below $1.29 would put $1.27-$1.25 back in focus. The chart’s broader visible low is $1.2457, which makes that another important downside reference.
On the upside, XRP first needs to recover $1.33-$1.35. Above that, $1.38-$1.40 becomes the next resistance area.
Read also: Holders Are Too Focused on XRP Price Predictions, Community Member Warns
XRP Indicators Analysis
Momentum indicators remain weak.
The chart shows:
- RSI 6: 27.43
- RSI 12: 37.59
- RSI 24: 40.84
- CCI: approximately -93.95
- MACD DIF: -0.0057
- MACD DEA: -0.0052
- MACD histogram: approximately -0.0011
The six-period RSI has moved below 30, placing XRP in short-term oversold territory. This increases the possibility of a relief bounce, but does not confirm that a bottom is in.
The longer RSI readings remain below 50, showing that momentum is still tilted toward sellers.
MACD has also turned negative again. DIF is below DEA and the histogram has slipped below zero, indicating that the latest rebound has lost momentum.
CCI near -94 tells a similar story. XRP is approaching an overstretched condition, but it has not reached the type of extreme reading that would independently signal a reversal.
XRP Price Prediction for Today
The $1.29-$1.30 area should decide the immediate direction.
| Scenario | Confirmation | XRP target |
|---|---|---|
| Bullish | Holds $1.29-$1.30 and recovers $1.33 | $1.35, then $1.38-$1.40 |
| Neutral | Remains between $1.29 and $1.35 | Continued consolidation |
| Bearish | Breaks below $1.29 | $1.27-$1.25 |
| Deeper bearish | $1.2457 fails | $1.20-$1.22 |
From $1.3065, a recovery to $1.35 would equal roughly 3.3% upside, with $1.40 representing about 7.2%.
On the downside, $1.25 is approximately 4.3% below the current price.
For October 17, XRP is oversold enough for another bounce attempt, but the technical structure remains bearish until price starts recovering at least $1.33-$1.35. Losing $1.29 would instead make another test of the $1.25 region increasingly likely.
For more crypto news and price predictions, click here.
Subscribe to our YouTube channel for daily crypto updates, market insights, and expert analysis.