The XRP price has been stuck in a falling wedge since peaking near $3.40 in July 2025. Most traders have looked away. But one analyst sees a familiar pattern. Silver broke out of a multi-year symmetrical triangle and soared 450% to a new all time high of $121.
XRP broke out of a similar multi-year symmetrical triangle in November 2024. Now XRP is trading within a falling wedge structure, and the bullish Wave 3 could take the XRP price to $8.
The silver comparison is not just a random chart match. It is a textbook technical sequence. And the XRP price is now at the same inflection point where silver launched its final leg up.
What you'll learn 👉
Silver’s Three-Wave Pattern That Led to $121
We had a look at the silver weekly chart shared by TheCryptoBasic. The pattern is clear. Silver spent years inside a large symmetrical triangle, coiling and compressing. When it finally broke out, the move was explosive.
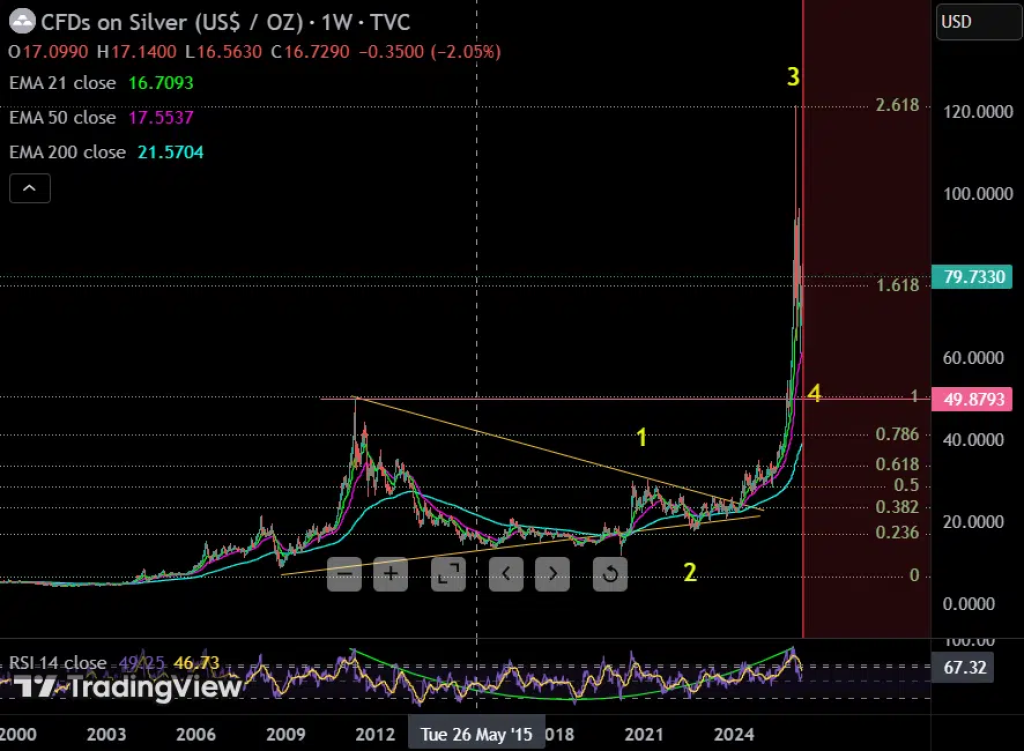
Silver went through a three wave pattern. Wave 1 was the initial breakout. Wave 2 was a pullback that shook out weak hands. Wave 3 was the parabolic run to $121. That was a 450% move from the breakout point.
The silver chart is now a case study in how long term consolidations resolve. The EMAs on silver are all stacked in a bullish configuration, with price trading above the 21, 50, and 200 period moving averages.
Wave 2 Is Almost Over – Wave 3 Could Send XRP to $8
The XRP weekly chart shared by TheCryptoBasic also looks like this almost exactly. XRP has broken out from its multi-year symmetrical triangle formation in November 2024. The first wave brought the XRP price up to $3.40.
Since then, the XRP price has been drifting lower inside a falling wedge. That is Wave 2. The wedge is the same structure that silver traded in before its final leg up. The EMAs on the XRP chart tell a mixed story. The 21 EMA is at $1.66, the 50 EMA at $1.91, and the 200 EMA at $1.40.
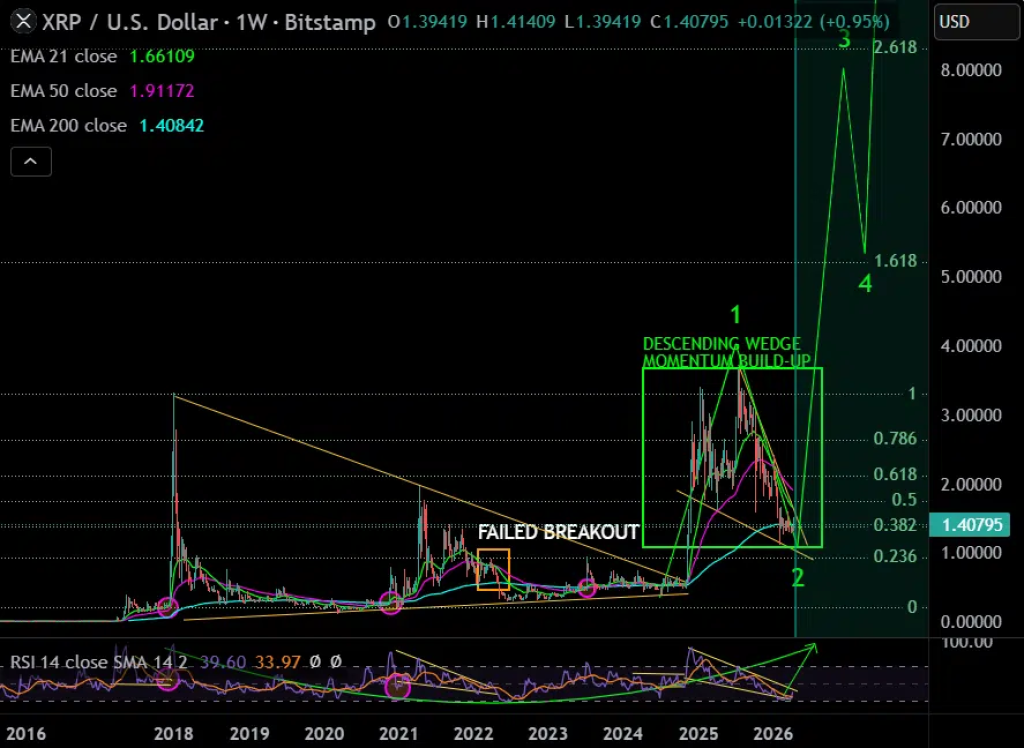
The XRP price is near $1.40, right at the 200 EMA support. The falling wedge is the key. Failed breakouts are labeled on the chart, but the overall structure is still intact. The XRP price is building upside momentum inside the wedge, just like silver did.
Since the RSI continues making higher lows even as price creates lower lows in a bullish divergence, then it confirms that sellers are now becoming exhausted. If price breaks above the resistance level of $1.50, it may target the Fibonacci extension levels of $1.65 to $1.73, but the ultimate goal is the Wave 3 level of $8.
Why the Comparison Matters
Silver and XRP are different assets, but the technical structure is the same. A multi year triangle breakout, a Wave 1 impulse, a Wave 2 pullback inside a falling wedge, and then a Wave 3 explosion. Silver already played out that script.
XRP is still in the Wave 2 phase. The wedge is the waiting room. The breakout is the door. The $8 target is the destination. The chart geometry is nearly identical to silver’s setup.
But here is our honest take at Captain Altcoin. Silver is a commodity with centuries of history. XRP is a digital token tied to one company. The charts rhyme, but the fundamentals are completely different.
$8 XRP would be a $450 billion market cap, ahead of Ethereum today. Possible? Maybe. But calling it a sure thing because silver did it? That feels like a stretch. We are watching, but not betting the farm.
Read Also: Ripple’s CTO Exposes DeFi’s Dirty Secret Following KelpDAO Exploit, XRP Price Stays Flat
Where the XRP Price Goes From Here
The current price of XRP is at $1.40, maintaining the 200 EMA support. Resistance on the falling wedge is expected between $1.60 to $1.70. A breakout above will mean that Wave 2 has ended, and Wave 3 has started, with the target being $8.
This is quite an ambitious forecast, considering that silver had a rise of 450% post-breakout. XRP rose 450% from its lowest price in 2020 to its highest in 2021.
Should there be a breakout, a realistic route for XRP is listed below. First, the resistance at $1.60 to $1.70. A clean breakout will see $2.00, $2.50, and the old peak at $3.40. Beyond that, there is $4.20, $5.00, $6.50, and lastly, the $8 target.
The pattern has worked before. From where we stand, the risk is a break below $1.35 support, which would put the wedge structure in doubt. But as long as the XRP price holds above the 200 EMA, the bullish case remains intact. The wedge is tightening. The breakout is coming. The only question is direction.
Subscribe to our YouTube channel for daily crypto updates, market insights, and expert analysis.