
XRP is trading around $1.50 after one of its strongest stretches in months, and the big question now is whether the recent rally was simply a powerful rebound or the beginning of a much larger trend change.
One analyst worth watching here is CasiTrades. We regularly cover her XRP analysis on CaptainAltcoin because she has been one of the more interesting XRP-focused technical analysts to follow, particularly when it comes to Elliott Wave structures and long-term price levels.
Her latest chart lays out a bullish path that could eventually take XRP toward $2.90. There is an important caveat, however. CasiTrades is not saying this move is already confirmed. Her entire scenario depends on XRP proving that the recent move from below $1 represents the beginning of a new trend.
What you'll learn 👉
CasiTrades Maps XRP’s Potential New Trend
CasiTrades starts her analysis from the macro 0.786 retracement area, where XRP recently found a bottom near $0.94-$1.00 before staging its major recovery.
The chart matters because the XRP price had spent months trending lower. Price fell from above $2.50 in late 2025, struggled through the first half of 2026 and eventually reached the macro support area in August.
That decline is marked as a larger corrective C wave on her chart. If that C wave is complete, the rebound from the August low may represent something much more important than another temporary bounce.
CasiTrades maps the current move as the beginning of a new five-wave Elliott Wave sequence.
Her first major target sits around $1.78. According to the analyst, reaching this area would complete the first five smaller waves and form subwave 1 of the new structure.
That would not mean XRP simply moves vertically higher from there.
Her roadmap actually calls for a substantial correction after $1.78, potentially taking XRP back toward $1.30. Such a move could look bearish in isolation, but within her Elliott Wave interpretation it would represent Wave 2 and would therefore be a normal retracement after the initial advance.
The more interesting part comes after that.
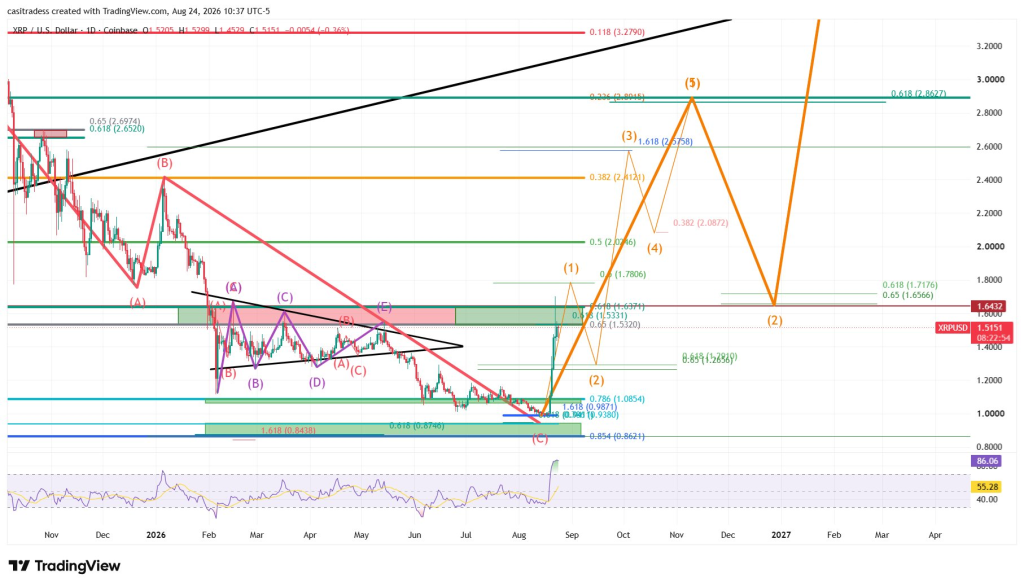
CasiTrades sees a potential Wave 3 advance targeting approximately $2.57. Wave 3 is typically expected to be one of the strongest portions of an Elliott Wave impulse, making this the stage where her bullish scenario would become much more noticeable.
The full five-wave sequence is then mapped toward approximately $2.90.
There are several intermediate levels on the chart, including resistance around $1.64, $1.78 and $2.00-$2.08 before the higher $2.40, $2.57 and $2.86-$2.90 regions come into play. XRP does not need to reach all of those levels immediately. The structure assumes rallies will be interrupted by corrections.
The $1.60-$1.65 Area Is XRP’s Immediate Test
The most important part of the analysis may actually be much closer to the current XRP price.
XRP is trading around $1.50, placing it directly underneath a resistance area that CasiTrades has been watching. Her chart puts a major horizontal level around $1.64.
This is where the new-trend thesis needs to begin proving itself.
A convincing move through this region would give XRP room to attack the analyst’s first $1.78 target. Failure to clear it could keep XRP trapped underneath resistance and weaken the immediate bullish setup.
The RSI at the bottom of the chart also deserves attention. It has moved into an extremely elevated area following XRP’s fast recovery. That confirms how powerful the recent momentum has been, but it also means short-term traders should not assume XRP will reach every upside target without pullbacks.
In fact, CasiTrades’ own roadmap expects exactly that kind of volatility.
Perhaps the most interesting part of her thesis comes much later. After a potential run toward $2.90, she maps a larger Wave 2 correction toward approximately $1.65.
In other words, today’s resistance could eventually become support.
If that entire structure develops as mapped, CasiTrades believes there is a realistic possibility XRP may not trade below $1.20 again. That’s a bullish scenario, not a certainty, and the current resistance test remains the first hurdle.
Read also: We Asked 3 AI Models If XRP Price Can Ever Reach $100
XRP Price Targets to Watch
Based on CasiTrades’ chart, the roadmap can be simplified to a few major areas.
The first upside objective is approximately $1.78. A correction toward $1.30 could follow before a potential Wave 3 advance toward $2.57. The larger five-wave target then sits near $2.90.
If that sequence completes, a bigger correction toward roughly $1.65 could follow before the next macro phase begins.
There is another important detail here: CasiTrades says the entire move toward $2.90 would represent only Wave 1 of a much larger macro Wave 3.
That puts the $2.90 target into perspective. Her chart is not presenting $2.90 as the final destination for XRP’s entire bullish cycle. It would instead mark the completion of an initial major leg if her long-term Elliott Wave count proves correct.
For now, there is little reason to jump that far ahead. XRP first has to turn the resistance it is currently facing into a confirmed breakout.
XRP News: XRPL Approaches Critical Amendment Threshold
There is also an important technical development taking place on the XRP Ledger.
The XRP Ledger Operations account has urged node operators to upgrade to xrpld version 3.3.0, with the fixCleanup3_3_0 amendment package moving closer to the consensus required for activation.
The amendment has reached more than 68% consensus. XRPL amendments require an 80% validator threshold before they can progress toward activation, leaving the proposal less than 12 percentage points away from that level.
For XRP holders, this is primarily network infrastructure news rather than a direct price catalyst. Upgrades and amendment coordination are important for maintaining the reliability and development of XRPL, but reaching the threshold does not automatically translate into additional demand for XRP.
Still, it arrives during a period in which attention around both XRP and its underlying network has increased considerably.
XRP Investment Products Attract Nearly $40 Million
Institutional flows provide another positive data point.
During the week of August 17 through August 21, U.S. spot Bitcoin and Ethereum ETFs recorded their strongest inflows since October 2025. XRP-focused products participated in the broader return of institutional capital, attracting $39.78 million in net inflows during the week.
The number is small compared with flows into Bitcoin and Ethereum products, but the direction is important.
XRP’s recent rally has therefore occurred alongside renewed demand for crypto investment products rather than entirely isolated speculative buying in XRP itself. That gives the recovery a somewhat stronger backdrop, particularly after months of weak price action.
Still, ETF flows can reverse quickly, and one strong week is not enough to establish a lasting institutional trend.
For XRP price, the chart now provides a relatively simple test. The recovery from the August lows has already happened. XRP is back around $1.50 and momentum has returned. What’s important now is whether buyers can push through the $1.60-$1.65 resistance region and eventually reach $1.78.
Subscribe to our YouTube channel for daily crypto updates, market insights, and expert analysis.