


XRP price is taking a breather after one of its strongest moves in months. Ripple’s token is down around 6.5% today and trades near $1.45, giving back part of the gains from a rally that lifted XRP roughly 50% from its recent lows.
The pullback itself is not particularly surprising after such a rapid move. Bitcoin and Ethereum are also down around 1.5% today, as some profit-taking hits the broader crypto market. XRP simply has more gains to give back after significantly outperforming both assets during the recovery.
In fact, XRP’s latest correction comes as one analyst argues that the much bigger technical picture may have just turned considerably more interesting.
What you'll learn 👉
Analyst Says XRP’s Next Impulsive Move May Be Starting
Crypto analyst Floppy posted a long-term XRP chart and said the token’s macro structure remains intact. More importantly, he believes the C leg of XRP’s macro Wave 2 correction may now be complete.
If that interpretation is correct, the recent rally could represent the beginning of a new impulsive Wave 3 rather than another temporary bounce inside the broader correction.
The weekly chart provides some context for why that distinction matters.
XRP spent years building a huge consolidation structure following its 2018 peak. That structure eventually tightened into a large triangle before XRP broke sharply higher in late 2024. The breakout carried the price from roughly $0.50 into the $3 area, forming what Floppy labels as the first major impulsive wave.
What followed was a large corrective structure.
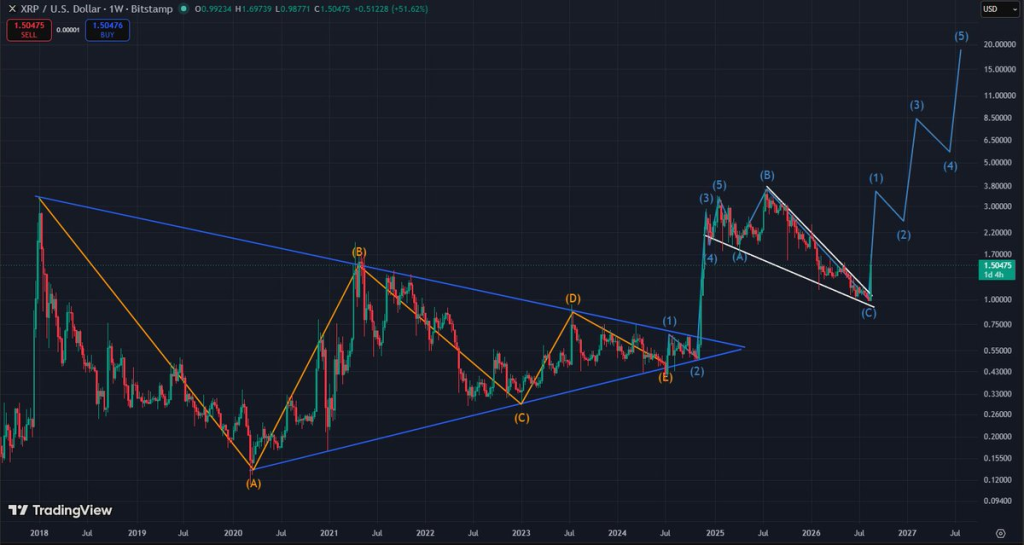
The chart marks XRP’s move toward approximately $3.60 as wave B before a prolonged decline formed the C leg. That correction eventually pushed XRP back toward the $1 area in 2026.
Floppy now believes that C wave may have ended.
That would make the area around $1 a potentially important macro low and explain why the latest rebound has been so aggressive. XRP didn’t gradually drift away from that level. It exploded higher, gaining around 50% in a matter of days.
The analyst wrote that this “could very well be the beginning” of the next high-time-frame impulsive move, adding that things could accelerate much faster than many traders expect.
How High Could XRP Price Go?
The bullish projection on Floppy’s chart is aggressive, but it is important to separate the immediate levels from the much longer-term targets.
His projected Wave 3 initially takes XRP back through the previous highs and toward roughly the $8-$9 region. The chart then anticipates a Wave 4 correction toward approximately $5-$6 before a potential fifth wave extends toward the $20 area.
Those are macro targets rather than short-term XRP price predictions. Several major hurdles would have to be cleared before such levels become realistic.
The first test is the old $3-$3.60 region. XRP would need to reclaim that area and establish a convincing higher high for the larger impulsive-wave scenario to gain much stronger technical confirmation.
For now, the behavior around $1 is arguably more important. The recent surge makes that zone look like a possible macro bottom, but XRP will need to maintain the new higher price structure after the current profit-taking phase.
Today’s 6.5% decline does not by itself invalidate the bullish setup. After a 50% rally, some traders locking in gains is expected. A deeper reversal that sends XRP back through recently reclaimed levels would be more concerning.
In other words, the next few sessions could help determine whether XRP is simply cooling off or beginning to surrender the breakout.
XRP News: Whale Takes $3.08 Million Leveraged Long
Trading activity around XRP has also become considerably more aggressive.
Data shared by BankXRP showed that a B+-rated whale opened a roughly $3.08 million XRP long position using 20x leverage at an entry price near $1.5465.
The position is notable because of both its size and leverage. At 20x, relatively small price movements can produce substantial gains or losses, making it a high-risk bet that XRP’s rally has further room to run.
At the same time, not everyone is chasing the move higher.
EGRAG CRYPTO noted that some traders who entered swing positions around $1.00-$1.10 have started taking profits. That makes sense after the speed of XRP’s advance. Someone buying at $1.00 and selling around $1.50 would be sitting on roughly a 50% gain before fees.
This also offers a straightforward explanation for some of today’s selling pressure. The decline does not necessarily mean traders have suddenly turned bearish. After a vertical rally, early buyers have a strong incentive to realize at least part of their gains.
Read also: XRP Price to $10? Analyst Says It’s “Not Crazy” as Another Targets $15
XRP ETF Inflows Hit Their Strongest Level Since May
There is also evidence that demand is not limited to leveraged crypto traders.
According to SoSoValue data provided for this article, U.S. spot XRP ETFs recorded $39.78 million in net inflows during the week ending August 21. That would make it their strongest week since May 2026.
August 21 was particularly strong, with $18.38 million flowing into the products as XRP surged around 20%. Bitwise’s XRP fund reportedly accounted for $16.89 million of the inflows.
The timing is important.
Strong ETF inflows arriving alongside a major spot-price breakout indicate that the rally was accompanied by increased demand through regulated investment products, rather than being driven exclusively by activity in leveraged derivatives markets.
Still, one strong week does not establish a lasting institutional trend. The next test will be whether ETF demand remains elevated after XRP’s initial price explosion cools down.
XRP Price Now Faces an Important Test
XRP holders finally have volatility again after weeks of relatively dull price action. A roughly 50% rally has transformed the short-term picture, but today’s correction is a reminder that such moves rarely continue vertically.
For now, a 6.5% decline after a 50% surge looks more like profit-taking than definitive evidence that the rally is over, particularly with Bitcoin and Ethereum also trading lower today.
Floppy’s chart takes the argument much further. His Elliott Wave interpretation proposes that XRP may have completed its entire macro correction near $1 and could now be entering Wave 3 — traditionally the strongest impulsive portion of a five-wave Elliott Wave sequence.
If he’s right, $1.45 would be nowhere near the end of the move.
But that thesis still needs confirmation. XRP first has to prove that the recent low can hold, establish a sustainable higher-low structure and eventually attack the major resistance left behind around $3-$3.60.
Subscribe to our YouTube channel for daily crypto updates, market insights, and expert analysis.






