
The silver price is trading near $66.27 as traders try to work out whether the latest correction is close to ending. MCO Global believes the $49-$60 support zone has held and that a smaller five-wave move from the summer lows could be the first sign of a larger recovery.
The silver price was at $66.2665, down 0.20% on the daily candle, with the chart showing a high of $66.2665 at the time of the analysis. MCO Global’s setup points to $74, $81, $89 and eventually $102 as the next major levels if the recovery continues. The broader Elliott Wave projection goes much further, with $190 marked as a potential Wave 5 target.
What you'll learn 👉
Why the Analyst Believes Silver’s Correction Could Be Ending
MCO Global’s bullish case starts with the $49-$60 support zone. The analyst says this area has held, and a small five-wave advance has started from the summer lows. The daily chart places the silver price inside a larger Wave 4 correction. Before this correction, silver climbed from a macro low near $34.50 to a Wave 3 peak around $130.
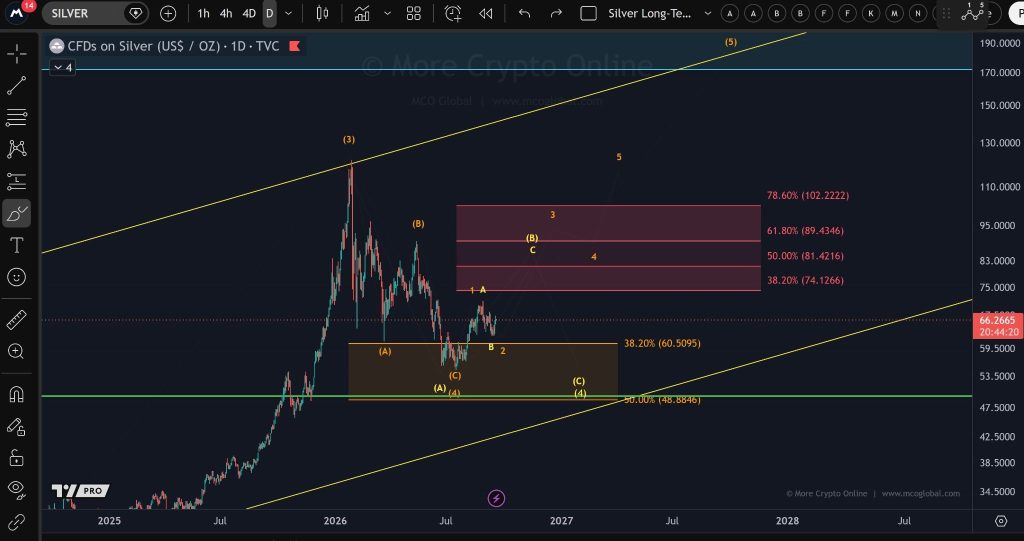
The correction then brought the silver price down toward $48.88 before the recovery toward $66.27. MCO Global has not treated the new five-wave structure as confirmed yet, but the pattern provides a potential path for another move higher.
That distinction matters because the analyst’s setup remains conditional. The chart needs the support zone to hold and the silver price to clear the resistance levels above it before the larger projection becomes more relevant.
Read Also: Here’s Where Gold and Silver Prices Might be Headed This Week
Silver Price Chart: The Five-Wave Pattern Taking Shape
On the silver chart, the first major resistance is $74.13. This is the 38.2% Fibonacci retracement level from the larger structure. If the silver price moves above $74.13, the next levels are $81.42, $89.43 and $102.22. These represent the 50%, 61.8% and 78.6% Fibonacci levels respectively.
The $89.43 level is particularly important because it marks the 61.8% Fibonacci retracement, commonly known as the golden pocket. A move through $102.22 would bring the previous Wave 3 peak near $130 back into consideration.
The larger Elliott Wave projection then places $190 as the potential Wave 5 target. That is a separate, much more ambitious projection from the initial $74-$102 path and depends on the full bullish count remaining valid.
What Could Invalidate This Bullish Silver Price Prediction?
On the support side, $60.51 is the first major level below the current silver price. This represents the 38.2% Fibonacci retracement of the recent pullback. Below it, $48.88 is the key support, followed by $34.50.
From $66.27 to $102.22, the silver price would need to climb roughly 54%. The path between those two points includes resistance at $74.13, $81.42 and $89.43. This gives traders several technical levels to watch instead of relying on one distant price target.
The main level that could weaken the bullish Elliott Wave count is $48.88. A break below that area would put $34.50 back on the chart as the next major support. For now, the silver price remains above the $49-$60 support zone identified by MCO Global. The next major test is $74.13. If that level gives way, $81.42, $89.43 and $102.22 become the next resistance areas to watch.
FAQs
Subscribe to our YouTube channel for daily crypto updates, market insights, and expert analysis.