
Gold and silver enter the new week after recovering from heavy mid-week pressure. The gold price fell from around $4,290 on September 14 to the $4,260 area before climbing back toward $4,390, giving it its first weekly gain in four weeks.
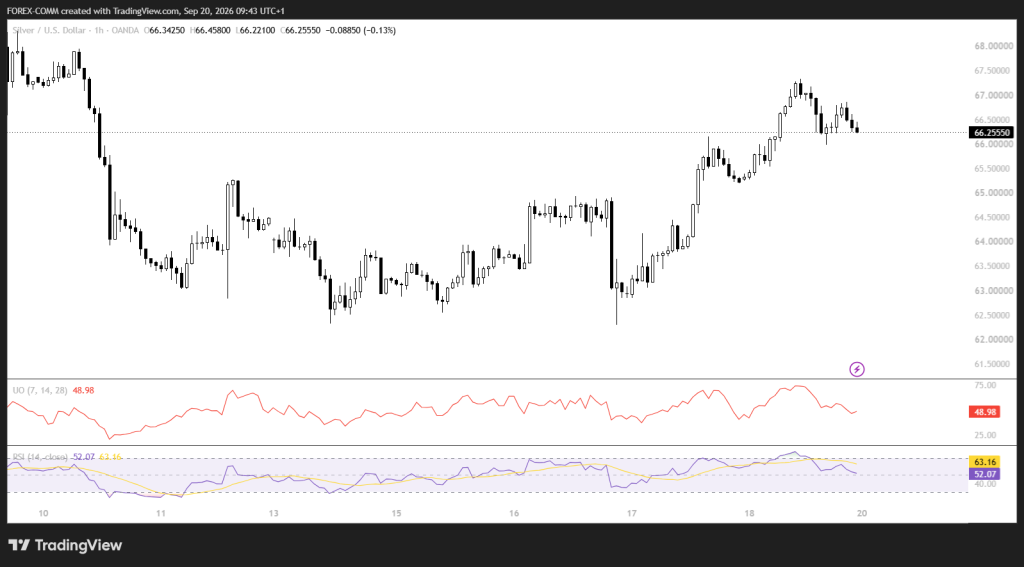
The latest chart shows the gold price at $4,378.36. Silver followed a stronger recovery, dropping toward $62.5–$63 before climbing above $66 and reaching around $66.70. Its latest chart price is $66.2555.
The key question now is whether both metals can extend that recovery or face another round of selling as traders assess Treasury yields, oil, Fed policy and this week’s US economic data.
What you'll learn 👉
Why Did Gold and Silver Recover Last Week?
The recovery came after the Federal Reserve delivered its widely anticipated 25-basis-point rate hike, taking the federal funds target range to 3.75%-4.00%.
Gold initially fell after the decision, but selling pressure faded as traders had already priced much of the move. Markets now put the probability of another October hike at around 58%, keeping rates as a major factor for bullion.
Oil prices also gave precious metals room to recover. Brent crude had traded near $110 earlier in the week before easing as concerns over Saudi supply disruptions moderated.
By Friday, Brent settled at $104.87, down 0.93%, and WTI settled at $100.30, down 1.58%. Lower oil prices reduced immediate inflation pressure, helping gold recover despite a 10-year Treasury yield near 5%.
The numbers show how strong the recovery was from the weekly lows. The gold price fell to around $4,235.60 before reaching roughly $4,439.80, a recovery of about 4.82%. Silver moved from around $63.33 to $67.89, representing a roughly 7.20% trough-to-peak move. Reuters also reported spot gold at $4,390.11 and silver at $66.70 on Friday.
What News Could Push Gold and Silver This Week?
The US economic calendar is lighter than last week’s Fed event, but several releases can still move the dollar, yields and precious metals. The September 21–25 schedule includes S&P Global manufacturing and services PMIs on September 23, weekly jobless claims and new home sales on September 24, plus durable goods and revised Michigan consumer sentiment on September 25. At least 10 Federal Reserve officials are also scheduled to speak during the week.
Treasury yields remain one of the biggest risks to the metals recovery. The 10-year yield returned to around 5.00% on Friday from 4.94% on Thursday, meaning another sustained move above 5% could pressure gold and silver. The dollar also matters because a stronger US currency increases the cost of bullion for overseas buyers.
Oil and Middle East developments are another major variable. Brent’s move from near $110 toward $104.87 reduced inflation pressure, but continued risks around the Strait of Hormuz and Saudi energy infrastructure could send crude higher again. That could complicate the Fed outlook and increase volatility across gold and silver.
Here’s What the Gold Chart Is Showing
We had a look at the chart, and the recovery remains intact above the $4,340-$4,350 area. The gold price climbed from the $4,260 region into the $4,390-$4,400 zone, but the latest candles show some selling around that resistance.
The next important upside area is $4,396-$4,405, followed by $4,440. A break above those levels would put the $4,466 area into view.
The indicators are not showing an overheated market. Gold’s RSI is 55.32, above the 50 midpoint, and its Ultimate Oscillator is 55.69.
That gives the chart a moderately positive momentum reading. The key downside levels are $4,340 and then $4,300; losing those zones would expose the $4,281-$4,235 region.
Related Silver News: Urgent Silver Price Prediction: Analyst Bets on a Big Rally by Christmas
Here’s What the Silver Chart Is Showing
Silver has recovered more aggressively, moving from below $63 to almost $67. The chart now places price at $66.2555, with resistance around $66.70 and then $68.00. A break through $68 could open the way toward $70.
The indicators are more mixed than gold. Silver’s RSI is 52.07, still above 50, but its Ultimate Oscillator is 48.98, just below the midpoint.
This means the silver price retains a positive price structure, but momentum needs to improve for a clean move above $67-$68. Support is around $65.50-$64.88, followed by $63.60.
Where Could Gold and Silver Prices Go This Week?
For gold, the bullish path is a break above $4,405, opening $4,440 and potentially $4,466. The range path keeps the gold price between roughly $4,340 and $4,405.
The bearish path begins below $4,340, with $4,281 and $4,235 becoming the next downside areas.
For silver, the bullish path requires a break above $66.70 and $68, with $70 as the next major target. The range path keeps the silver price between $64.88 and $67.00. The bearish path starts below $64.88, exposing $63.60 and then $62.97.
Frequently Asked Questions
Subscribe to our YouTube channel for daily crypto updates, market insights, and expert analysis.