
Stellar could rally 20% from the $0.136 price on More Crypto Online’s chart and only just reach the first level where the analyst expects sellers to show up. That’s how much ground XLM has lost since its October peak near $0.23. For now, buyers have a more immediate problem. A price level that stopped two previous selloffs has given way, and the next support line runs just below the latest daily candle.
More Crypto Online thinks XLM may already be in the third wave of a decline on the daily Coinbase chart. In Elliott Wave analysis, the third wave is often the part of a move where selling accelerates. The analyst left one question open: does Stellar get a bounce first? The chart gives buyers a chance at one, though it also shows why an early rebound could be easy to misread.
What you'll learn 👉
What Changed When Stellar Slipped Below $0.14?
Look at the red horizontal line near $0.14. XLM tested that area early in 2026 and returned to it in May. The second test gave way to a rally that briefly carried Stellar close to $0.30. Buyers had good reason to watch the same level when the price came back in November.
The trouble was visible before XLM got there. Its next substantial rally peaked near $0.23 in October, well below the earlier high near $0.30. More Crypto Online labels that October peak as the end of an A-B-C recovery and the top of wave two. Selling then carried XLM through the old floor, with the latest price marked at $0.136056. The daily candle was still open when the analyst captured the chart, so a close below support was still an open question.
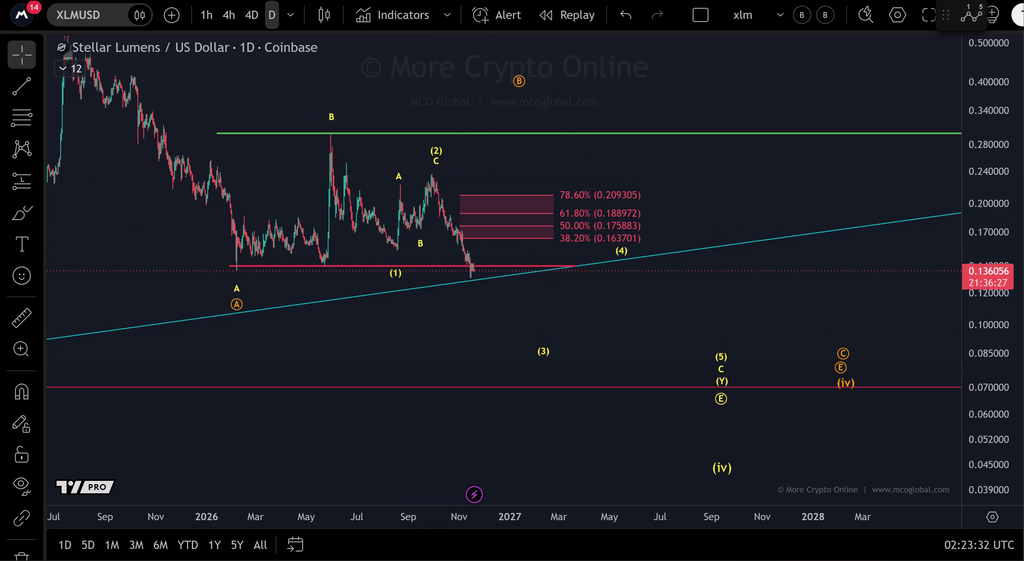
Just beneath that candle, a rising turquoise trendline passes through roughly $0.13. That leaves two nearby levels with different jobs. A bounce off the trendline would show that buyers are willing to step in around $0.13. Getting back above $0.14 and holding it on a retest would be the first sign they can recover ground they previously defended.
Why a 20% XLM Rally Could Still Fit the Bearish Forecast
More Crypto Online places the first resistance zone between $0.1637 and $0.2093. Those are Fibonacci retracement levels, which mark how much of the latest decline a rebound would recover. The lower edge is about 20% above the chart price. Near $0.1759, XLM would have retraced half the decline. The next two levels are $0.1890 and $0.2093.
Those numbers put a potential rally in perspective. If XLM rebounds to $0.164 and sellers immediately push it back below $0.14, the move would fit the analyst’s bearish reading. A recovery through $0.189 followed by daily closes above $0.209 would make an immediate wave-three selloff harder to defend. The stronger challenge would come near $0.23. A move above the October peak would take XLM above the point where the analyst’s third wave supposedly began and force a fresh wave count.
How Far Could Stellar Fall if $0.13 Gives Way?
The analyst places a yellow wave-three marker near $0.085 and marks a lower horizontal level at $0.07. From $0.136, those prices represent declines of roughly 38% and 49%. The chart also sketches a fourth-wave rebound between the third and fifth waves. The labels illustrate one possible sequence over time. Their placement gives neither a firm price target nor a reliable date for a low.
My read is that the next test of $0.14 will tell us more than the distant $0.07 line. A brief dip below an old floor can reverse quickly. A daily close below the rising trendline near $0.13, followed by a failed attempt to reclaim $0.14, would be more convincing evidence that former buyers are selling into rebounds.
If XLM instead recovers $0.14 and holds it, the first meaningful test for that bounce comes at $0.1637. That’s where a 20% gain would start to answer the question Stellar holders care about: how much of October’s decline can buyers actually take back?
For more crypto news and price predictions, click here.
Subscribe to our YouTube channel for daily crypto updates, market insights, and expert analysis.