
XRP price was trading just under a dollar when Celal Kucuker published a chart pointing to $7. The most revealing detail is how long he gives XRP to get there. His projection leaves room for another dip and months of uneven trading near $1 before the rally picks up. Anyone reading his post as a call for an immediate rebound gets a different impression from the chart itself.
Kucuker’s argument comes down to a rising blue line on XRP’s monthly Bitstamp chart. “Blue support has never failed. Every previous touch led to a new ATH,” he wrote on X. The price displayed on the chart was about $0.986. From there, reaching $7 would mean a gain of roughly 610%. Here’s what the earlier touches actually look like and where I think his case gets a little too optimistic.
What you'll learn 👉
What XRP Did the Last Time It Approached the Blue Line
The clearest example comes from 2020. XRP fell toward $0.16, briefly traded below the blue line and recovered. Buyers who entered near that low eventually saw XRP trade above $1 during the 2021 rally. A few years later, XRP spent much of 2022 through 2024 closer to the same rising line before a late-2024 run took it back above $2.
Both periods give Kucuker a reason to watch the line again. They also complicate his claim about all-time highs. On the Bitstamp chart he shared, the 2021 peak fell well short of the spike in early 2018. Someone who bought near support in 2020 could have made several times their money and still waited years for XRP to challenge its old record. That’s a meaningful difference for anyone using this pattern to put a date on $7.
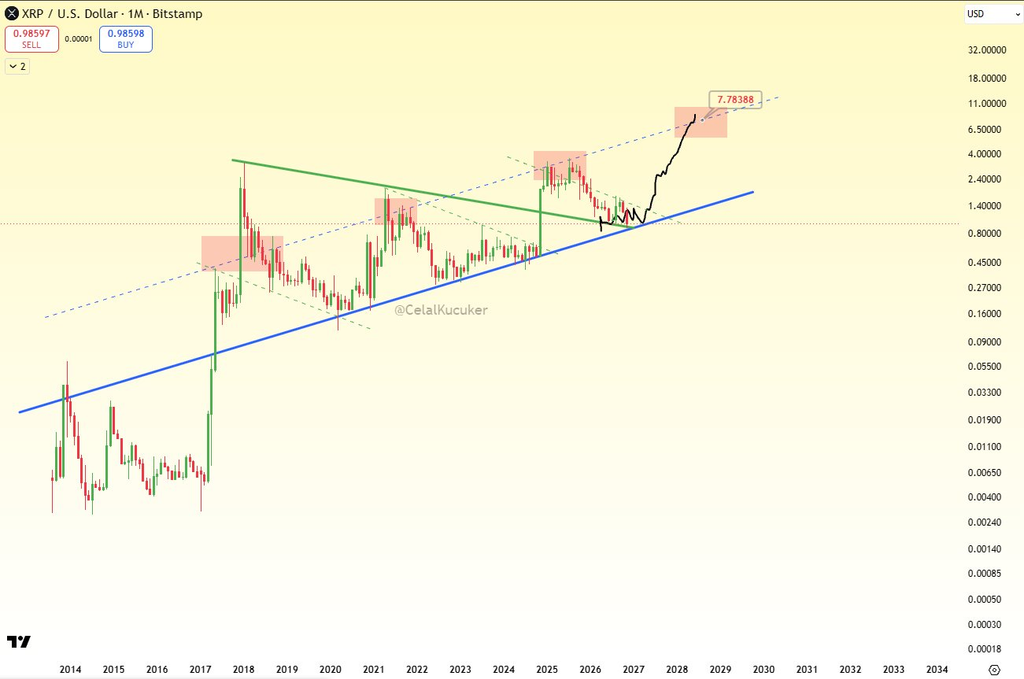
There’s another detail worth keeping in mind. Kucuker uses a logarithmic chart, where equal distances represent equal percentage moves. The blue line rises over time, so the price XRP needs to hold depends on when it gets there. Calling $1 a permanent floor would miss how he drew the setup.
Where the $7 XRP Price Target Comes From
The blue line explains where Kucuker expects buyers to return. A second line, drawn in blue dashes above the price, helps explain where he thinks the rally could end. He marks earlier rallies with shaded boxes along that upper line, then adds another box around 2028 and 2029. The chart labels a point in that area at about $7.78, a little above the $7 he mentions in his post.
Follow the black path between those two lines and the forecast is less aggressive at first than the headline number sounds. XRP moves back and forth near $1, approaches the rising support and only then begins the steep part of the move. The largest gains appear years out on the chart. Kucuker gave no firm deadline in his post.
Read also: XRP Holders Got Left Behind as Ripple Built a $40B+ Company
What Would Make the $7 XRP Target More Convincing?
I’d give the lower line more weight than the upper target. The monthly history gives a reasonable basis for watching how buyers behave around support. It gives us much less to work with when choosing between a rebound to $2, a return to the old highs or a run all the way to $7. The 2021 rally is a good example of how the support call can work even when the record-high call falls short.
My first test would be whether XRP can recover the area around $1.40 and hold it on a monthly close. That would put some distance between the price and the recent lows. Beyond that, I’d want to see buyers take on the roughly $2.40 to $4 region where the previous rally ran into sellers. A move through that region would make the upper target far more interesting.
On the downside, the chart’s own history leaves room for a brief dip beneath the blue line. A monthly close below it followed by a failed attempt to get back above would do more damage to Kucuker’s argument. At around $1, the chart gives XRP bulls a place to look for a recovery. How XRP handles $1.40 would tell me more about its chances of reaching $7 than another touch of the trendline alone.
For more crypto news and price predictions, click here.
Subscribe to our YouTube channel for daily crypto updates, market insights, and expert analysis.