While Bitcoin struggles to conquer the $31k zone, other coins are battling their own wars.
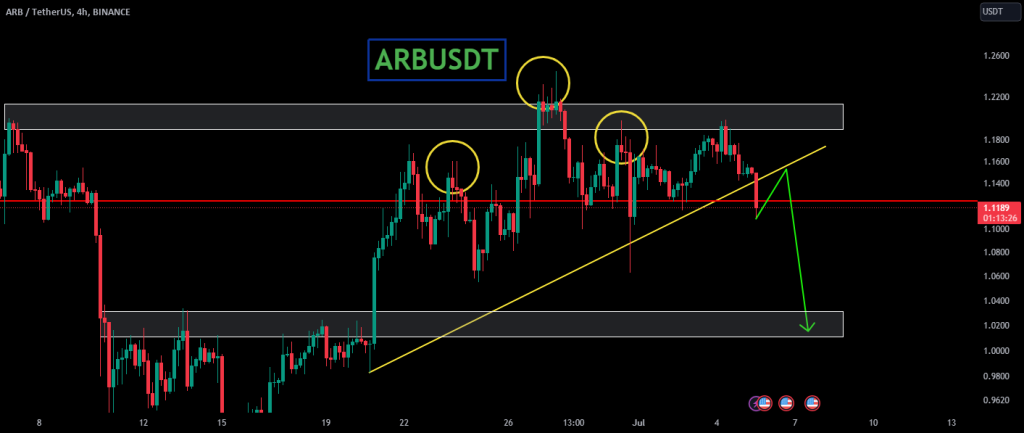
Starting with ARBUSDT, the chart has formed a Head and Shoulder pattern, a classic reversal pattern, and has also broken the neckline. This combination of factors could potentially exert selling pressure on the instrument. It’s an interesting development that warrants close observation in the coming days.

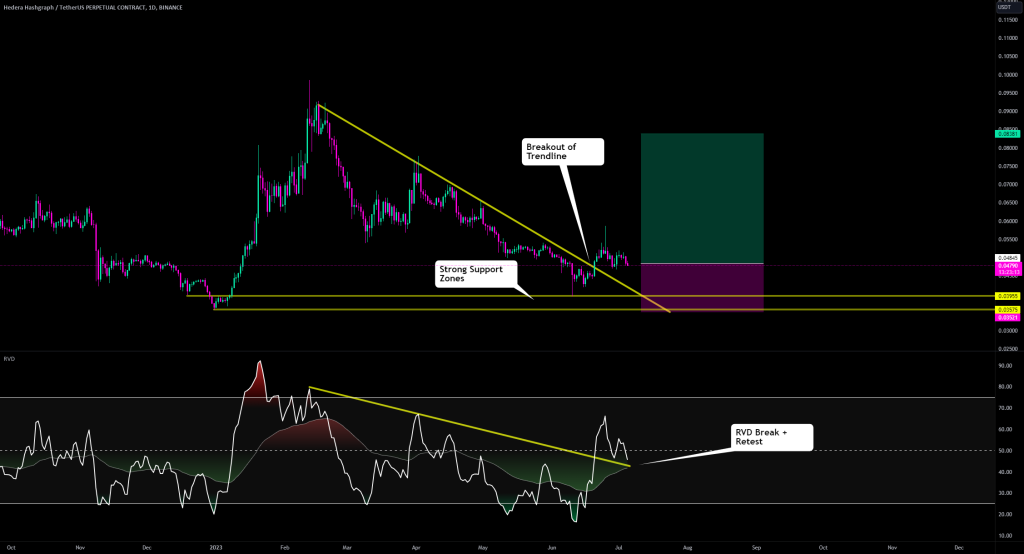
Moving on to HBAR, it has broken out of a key price trendline and is looking to potentially retest. There is an expectation of further short-term downside, suggesting a cautious approach might be the best strategy at this point. However, from a macro perspective, HBAR appears strong with a breakout and retest on the RVD trendline. This could signal a potential upswing in the future.

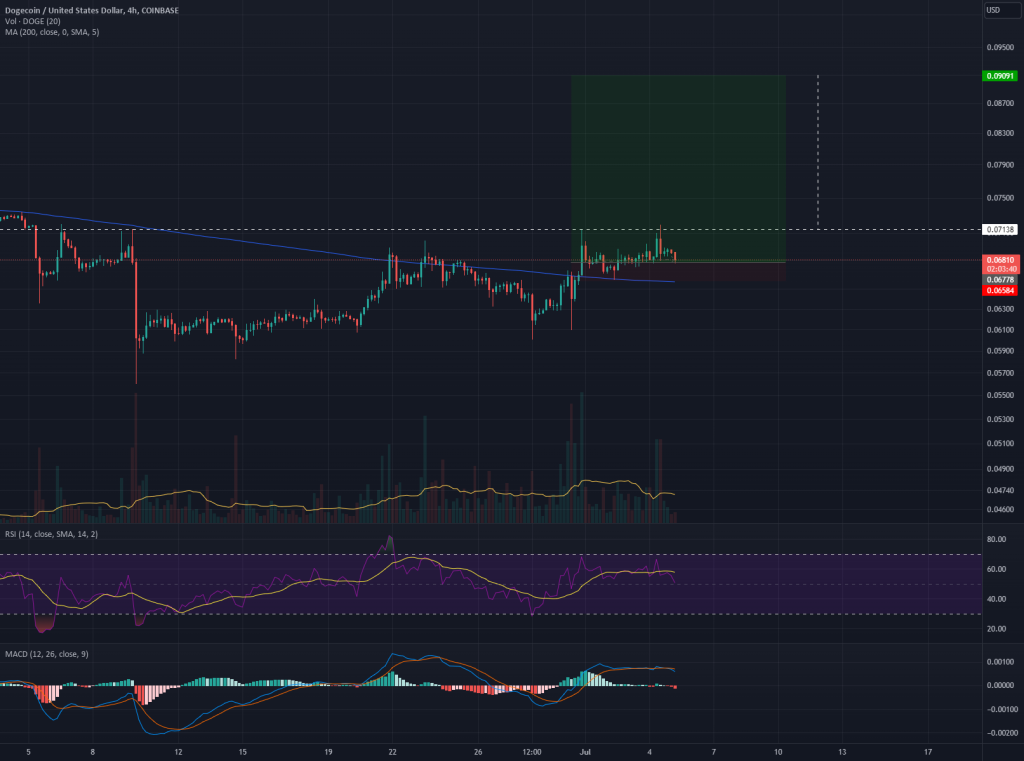
The DOGEUSD chart presents an interesting scenario. It appears to be forming an Inverse Head and Shoulders pattern. While it might look a bit off, the pattern seems to be there. The current strategy would be to enter now, place a stop under the 4-hour swing low, and aim for .0905 for an approximate 33% gain.

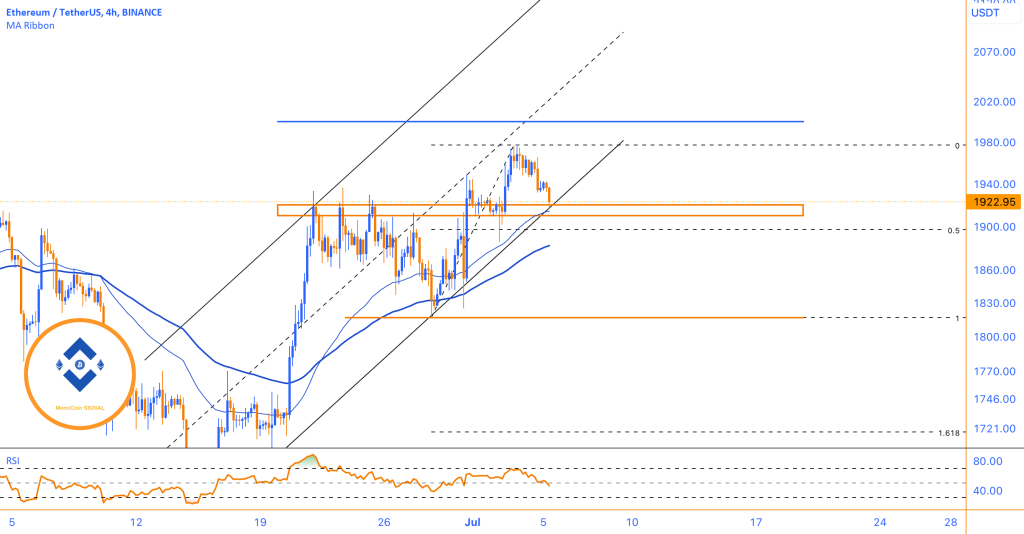
Lastly, Ethereum is retracing towards the support range after a decisive breakthrough of the upper boundary of the channel. Within this range, there exist three support levels, ranging from $1920 to $1910. As long as this support range remains intact, buyers can continue to pursue the price targets established within the $2000 price channel for Ethereum.

These analyses provide a snapshot of the current state of the market. However, it’s important to remember that the world of cryptocurrency is highly volatile and subject to rapid changes. As an analyst, the key is to stay updated and adapt to these changes swiftly.


