
XRP price is boring to hell this week. The token is still trading around $1.00 , barely moving in either direction. As I joked in one of our previous XRP pieces today, it does look like XRP is a stablecoin now if you look at the price action in the last few days.
Last week, in our weekly XRP price prediction article, we predicted that “The base case is still consolidation. If Bitcoin continues moving sideways, XRP could spend another week trading between $1.05 and $1.10. The downside levels are also easy to identify. A break below $1.05 would put $1.00 back on the table.” And that is exactly what happened – $1.00 is “on the table” right now.
What you'll learn 👉
XRP/USDT Chart Analysis: Relief Bounce Inside a Downtrend
The dominant story on the chart is a sustained downtrend followed by a sharp reversal.
Price Action Timeline:
From August 8-9, price consolidated in the $1.05-$1.06 range after a brief bounce attempt. Then, from August 9-12, a steady, grinding decline took price from roughly $1.05 down through $1.03, $1.02, and $1.00 – a clean sequence of lower highs and lower lows with minimal relief.
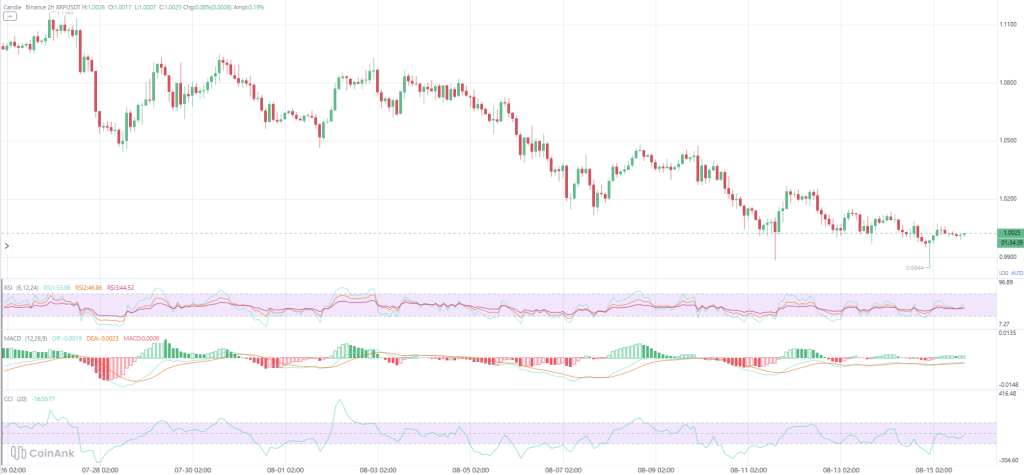
A sharp flush to $0.9844 followed on August 12-13 – the low of the entire chart period – likely a liquidity and stop-hunt wick below the psychological $1.00 level. Since then, XRP has sharply reclaimed back above $1.00, followed by consolidation in a tight $0.99-$1.02 range, with price currently sitting right at $1.0015-$1.0018.
Zooming out to the full chart (July 26 onward): XRP has been in a broader downtrend since topping near $1.11 on July 26. Every bounce (July 30, August 3, August 9) has been sold into, forming a descending staircase pattern.
Support and Resistance Zones:
| Level | Type | Significance |
|---|---|---|
| $1.02-$1.03 | Immediate resistance | Ceiling of recent consolidation |
| $1.00 | Key psychological pivot | Price is glued to this level |
| $0.9844 | Immediate support | Recent flash-low wick |
| $1.05 | Higher resistance | Tested multiple times |
| $1.08 | Higher resistance | Tested multiple times |
| $1.11 | Higher resistance | Origin high of the downtrend |
Momentum Indicators: Bearish Trend, Early Bullish Crossover
RSI (6, 12, 24): All three RSI lines are clustered in the 43-45 range (RSI1: 45.04, RSI2: 44.12, RSI3: 43.51) – solidly below the neutral 50 midpoint but nowhere near oversold territory (30). This reflects the grinding, non-panicky nature of the sell-off. Momentum is soft and bearish-leaning, not exhausted or reversing hard. The tight clustering also suggests low volatility and indecision at current levels.
MACD (12, 26, 9): DIF is -0.0019, DEA is -0.0023, and the Histogram is +0.0008. Both the DIF and signal lines remain below the zero line, confirming the broader trend is still technically bearish. However, DIF is now sitting above DEA with a small positive histogram bar – this is an early bullish crossover signal, consistent with the bounce off $0.9844. This is a classic “counter-trend bounce” MACD signature: real, but not yet strong enough to flip the larger trend bullish.
CCI (20): Currently at -25.52 – squarely in neutral territory (the extreme zones are typically ±100). Notably, CCI spiked well above +200 briefly around August 3 (the local top before the big decline began) and dipped toward -200+ near the August 12 flash low, both marking those turning points accurately in hindsight. Right now, sitting near zero suggests the market has cooled off from both the panic-sell and the reflex-bounce – genuinely indecisive.
Overall Read: Trend remains technically bearish on the broader structure (lower highs since July 26). But momentum indicators – MACD histogram turning positive, RSI stabilizing – suggest selling pressure has eased. The key level to watch is $1.00-$1.02. A confirmed break and hold above $1.02-$1.03 would be the first real technical sign this bounce has legs toward $1.05. Failure here, followed by a re-test and break of $0.9844, would open the door to new lows below $0.98.
Read also: We Asked AI What XRP Could Be Worth If Bitcoin Hits $500K Next Bull Run
XRP News: Security Audit, Whale Accumulation, and SEC Meeting
Security Audit Finds 96 Vulnerabilities
Before the release of XRP Ledger version 3.3.0, a $550,000 community audit contest hosted by Sherlock identified 96 vulnerabilities, including two critical flaws that could have drained user accounts. The bugs were patched before the code reached any live wallet.
Whales Accumulate 72 Million XRP
Despite XRP’s price struggling to hold $1 and trading below all key moving averages, on-chain data reveals a significant counter-trend move. Whales increased their aggregate holdings by 72 million XRP in a 24-hour period. This accumulation coincided with a return of $2.25 million in net inflows to XRP ETFs, led by Bitwise.
SEC Cancels “Regulation Crypto” Vote
The Securities and Exchange Commission abruptly canceled its August 14 open meeting, where it was scheduled to vote on the proposed “Regulation Crypto” framework. No new date was provided, citing an “unforeseen scheduling issue.” The development comes as Ripple executives are set to attend Wednesday’s White House crypto summit, where the Clarity Act is expected to be a key topic of discussion.
XRP Price Prediction for Next Week
The chart is at a genuine decision point, with bulls and bears essentially tied at the $1.00 psychological line.
Bullish Scenario (30%):
If XRP breaks and holds above $1.02-$1.03 with volume, the next targets are $1.05 , then $1.08 , and potentially $1.11 . The MACD bullish crossover would gain momentum, and RSI would move above 50. This scenario requires positive news from the White House summit or a surprise Clarity Act breakthrough. Whale accumulation and ETF inflows could provide the fuel.
Base Case (50%):
XRP continues to consolidate between $0.99 and $1.02 . The $1.00 level acts as a magnet. Low volume. No clear direction. The market waits for the White House summit outcome and the Clarity Act’s fate. This is the most likely outcome for the next week. The MACD crossover is early and weak, and RSI is neutral.
Bearish Scenario (20%):
If XRP loses $0.9844 , the next support is $0.95 , then $0.94 (CasiTrades’ buy zone), and potentially $0.87 . The downtrend would accelerate, and the MACD bullish crossover would fail. This scenario would be triggered by negative news from the White House summit, further Clarity Act delays, or a broader crypto market correction.
My take: The $1.00 level is the line in the sand. The MACD bullish crossover is a positive sign, but it is early and weak. The broader trend is still down. I am watching the $1.02-$1.03 resistance. A break above that would be the first real bullish signal. Until then, the path of least resistance is sideways to lower.
Subscribe to our YouTube channel for daily crypto updates, market insights, and expert analysis.