

XRP price has staged a big comeback as the broader crypto market recovers; Ripple’s token climbed from around $1 to $1.40 in a matter of days. That represents a gain of roughly 40% from the recent low and puts several resistance levels back in play after months of weak price action.
The rally also appears to have validated a technical signal that some XRP traders had been watching before the move began.
Popular XRP community analyst EGRAG Crypto said the bullish divergence visible on XRP’s chart is now playing out. Price had continued grinding lower near $1 even as the Relative Strength Index (RSI) started forming higher lows.
That divergence indicated that selling momentum was weakening before XRP itself turned higher.
According to EGRAG, the sequence has now moved from bullish divergence to a momentum shift and finally to price expansion. XRP’s rebound toward $1.40 is the first major result of that setup.
The bigger question is what comes next.
What you'll learn 👉
XRP Price Bullish Divergence Plays Out
Bullish divergence occurs when an asset’s price continues falling or forms lower lows, but a momentum indicator such as RSI begins moving in the opposite direction.
That is essentially what EGRAG’s chart shows.
XRP had been under persistent pressure, eventually falling toward the psychologically important $1 level. At the same time, the RSI shown at the bottom of the chart stopped following price lower.
Instead, momentum began forming higher lows.
This creates a disconnect: price is still declining, but the strength behind the decline is fading. It doesn’t guarantee a reversal, but it can provide an early indication that sellers are becoming exhausted.
That appears to have mattered in XRP’s case.
After holding around the $1 region, XRP quickly reversed and surged toward $1.40, producing approximately 40% upside from the recent low.
EGRAG described the progression simply: bullish divergence first, followed by a shift in momentum and then price expansion.
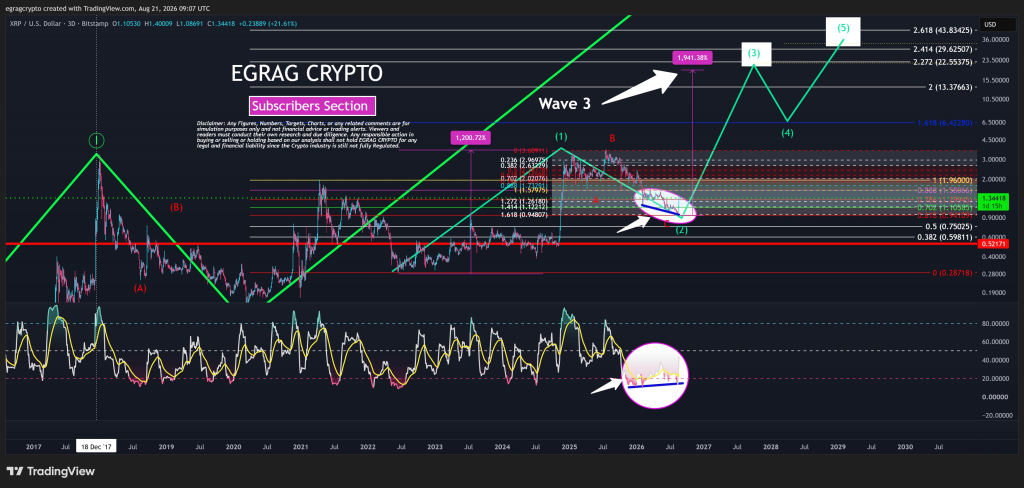
The chart now shows XRP moving away from the area the analyst labels as a potential Wave (2) bottom. Still, EGRAG isn’t calling the larger breakout confirmed yet.
$1.58-$1.60 Is the First XRP Price Test
The first area to watch is approximately $1.58-$1.60.
EGRAG’s chart places a Fibonacci level around $1.58, making this the nearest significant resistance above the current XRP price.
From $1.40, reaching $1.60 would require another gain of roughly 14%.
A rejection here wouldn’t necessarily destroy the recovery. XRP has already moved very quickly from $1, so some consolidation after a 40% rally would be normal.
A decisive move through $1.60, however, would clear the first major hurdle identified in EGRAG’s roadmap.
The next level becomes considerably more important.
Read also: XRP Price Finally Makes the Move Bulls Have Been Waiting For!
Why $1.96 Could Decide What Happens Next
EGRAG identifies $1.96 as the level needed for what he calls “macro confirmation.”
That price corresponds closely with another major Fibonacci level on his chart and sits around an area that previously acted as an important battleground for XRP.
This means the current rally and a full bullish structural reversal shouldn’t be treated as the same thing.
At roughly $1.40, XRP has demonstrated that buyers are returning. At $1.96, the market would begin demonstrating something more substantial.
A rally from $1.40 to $1.96 would amount to another 40% increase.
More importantly, reclaiming $1.96 would put XRP back above a cluster of resistance levels that developed during its previous decline.
This is why EGRAG says a break above $1.96 would strengthen his Wave 3 thesis.
In Elliott Wave analysis, a third wave is typically expected to produce the strongest portion of an impulsive move. If the analyst’s interpretation is correct, the current recovery could eventually develop into something substantially larger.
It hasn’t done that yet.
Could XRP Price Return to $3-$3.60?
If $1.96 falls, EGRAG’s attention moves toward the $3-$3.60 region.
This area is important because it corresponds with XRP’s previous major high and what the analyst identifies as the Wave 1 breakout zone.
At $3, XRP would be approximately 114% above a $1.40 starting point.
At $3.60, the gain would increase to roughly 157%.
That makes this a much more ambitious scenario than simply extending the current relief rally.
The chart also shows why $3-$3.60 could be difficult to clear. XRP previously encountered substantial selling pressure around this region, meaning investors who bought near earlier highs may use another visit to exit positions.
Breaking $3.60 would therefore represent a far more significant structural development than the current move through $1.40.
EGRAG goes even further, saying that above $3.60, his long-term “20x macro thesis” would begin to gain credibility.
His chart maps an Elliott Wave projection considerably higher after such a breakout. The illustrated Wave 3 path extends toward the $20+ region, with later Fibonacci extensions marked around $22.55, $29.63 and $43.83.
Those are highly speculative long-term targets, not levels confirmed by XRP’s current price action. The XRP price would first have to overcome several major resistance areas, beginning with $1.58-$1.60 and $1.96.
XRP Price Prediction: What Happens From Here?
For the immediate XRP price outlook, $1.58-$1.60 is the first level that matters.
A clean move above this region could open the door toward $1.96. Reclaiming $1.96 would provide much stronger evidence that the move from $1 is developing into a broader bullish reversal rather than simply a sharp recovery from oversold conditions.
From there, $3-$3.60 becomes the major breakout zone.
The bullish roadmap can therefore be simplified to:
$1.40 → $1.58-$1.60 → $1.96 → $3-$3.60
Each step requires fresh confirmation.
There is also a bearish scenario that shouldn’t be ignored. XRP has risen approximately 40% very quickly, and much of the move has occurred alongside a broad crypto market recovery. If Bitcoin and the rest of the market lose momentum, XRP could retrace part of its latest surge.
The chart itself contains support levels around $1.29, $1.11 and $0.95. Losing those areas would progressively weaken the bullish interpretation, particularly if XRP eventually returned toward or below the recent $1 region.
For now, however, the signal EGRAG was watching has done what bullish divergence is supposed to do: momentum turned before price, selling pressure weakened, and XRP subsequently expanded higher.
Subscribe to our YouTube channel for daily crypto updates, market insights, and expert analysis.






