
Gold and silver enter a new week at a vital point after a volatile finish to September. Gold price is trading at $4,142.33 after Friday’s rebound failed to erase pressure from a stronger dollar and elevated Treasury yields.
Silver price is trading at $60.447 after dropping toward $60.5, with the metal on course for a weekly loss of almost 6%. The latest US jobs report adds a twist: September payrolls increased by only 29,000, unemployment rose to 4.2%, and annual wage growth eased to 3.0%.
That data reduced expectations for a Federal Reserve rate hike this month. With oil, yields, the dollar and Fed policy pulling in different directions, here’s where gold and silver prices might be headed this week.
What you'll learn 👉
What Has Been Pushing Gold and Silver Prices This Week?
Geopolitical pressure initially worked against precious metals after Donald Trump rejected Iran’s proposal for a seven-day truce aimed at reopening the Strait of Hormuz. Brent crude climbed above $100 and reached around $106.50, raising fears that higher energy costs could keep inflation elevated.
That fed expectations for another 25-basis-point Fed hike, with October hike odds moving above 70% earlier in the week. The 10-year Treasury yield also climbed above 5.2%, increasing the appeal of interest-bearing assets over gold and silver.
The dollar added more pressure as the DXY moved above 100 amid higher yields and a more hawkish Fed outlook. Since gold and silver are priced in dollars, a stronger greenback can make both metals more expensive for international buyers. The combination of higher oil, Treasury yields and the dollar helped push gold toward $4,100 and silver toward $60.
The mood changed late in the week after softer US inflation data and weak employment numbers reduced rate-hike expectations. September payrolls increased by only 29,000, compared with expectations near 90,000, unemployment rose to 4.2%, and annual wage growth eased to 3.0%.
July and August payrolls were also revised down by a combined 60,000. Market pricing for an October hike fell from around 70% to roughly 31%, giving gold and silver room to recover some losses. Markets are also pricing roughly a 75% probability that the Fed will leave rates unchanged this month.
Here’s What the Gold Chart Is Showing
Gold price has maintained a bearish structure since failing around $4,400 in mid-September. The chart shows lower highs from the September 10 area near $4,430 toward $4,380 and then $4,300 before the latest decline. Gold price then broke below $4,200 and reached the 4,100-4,120 region. That area is now the first major support zone.
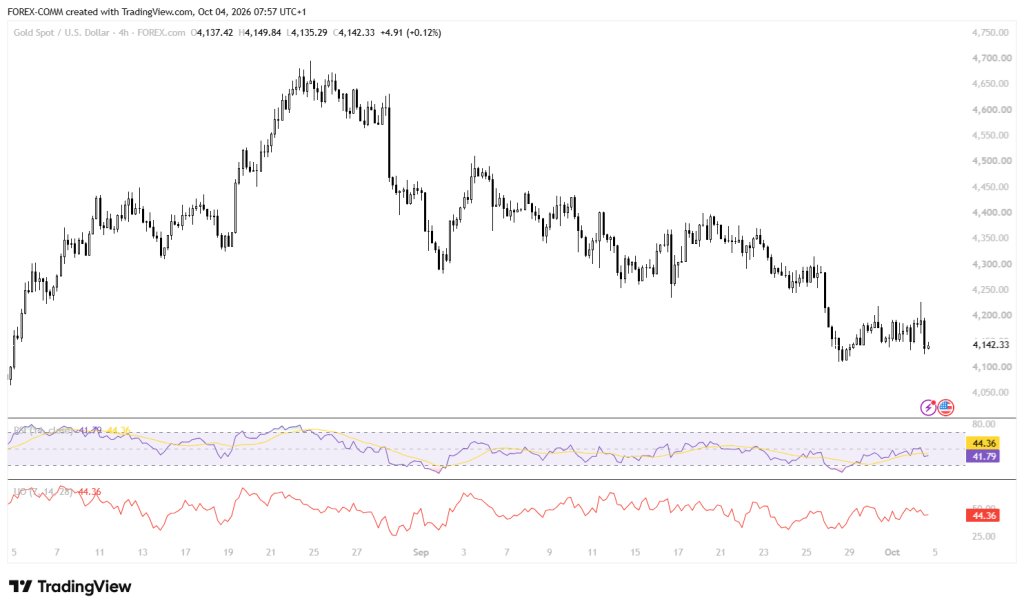
Momentum remains weak but is no longer deeply oversold. The RSI is 41.79, below its 44.36 moving average, showing sellers still have an advantage. The ADX is 44.36, indicating a well-established trend, so a break of support could produce another sizeable move. A recovery above $4,200 would be the first sign that buyers are regaining control.
For the bullish case, gold price needs to reclaim $4,200, opening the door toward $4,300-$4,350 and potentially $4,400. The bearish case comes if $4,100 fails, with $4,050 and $4,000 becoming the next areas to watch. A third path is consolidation between $4,100 and $4,200 before the next breakout.
Related Gold News: Gold Price Today: Investors Feel Angry as Market Cycle Points to More Pain
Here’s What the Silver Chart Is Showing
Silver price has also developed a clear bearish structure, falling from the $67-$68 region in late September toward $60.447. The chart shows repeated lower highs after the September 23 area, followed by a decisive break below $64 and then $62. The $60 area is now the key level for buyers.
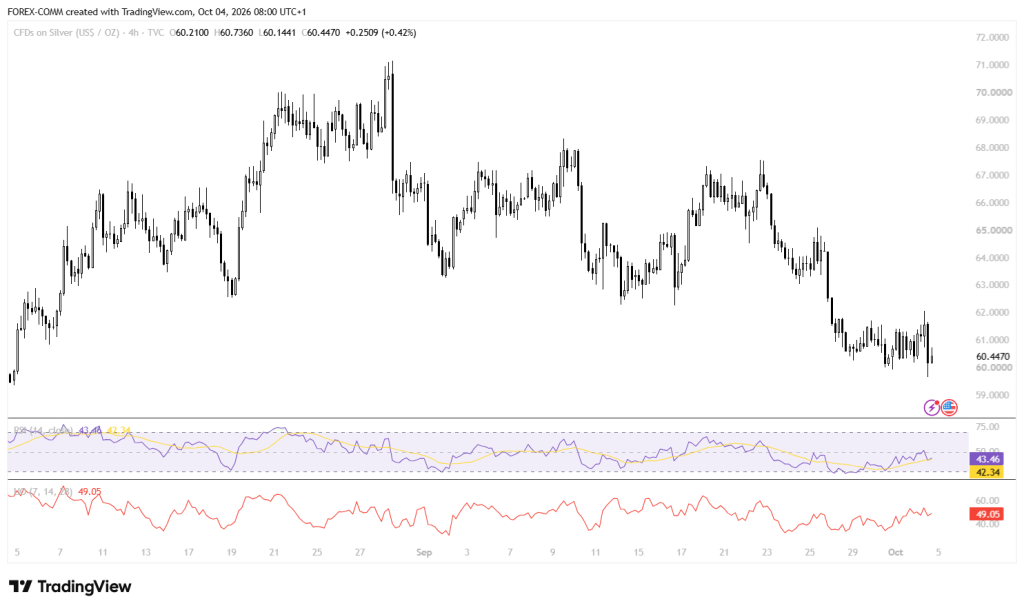
The RSI stands at 43.46, slightly above its 42.34 moving average. That gives silver price a little more momentum support than gold, although the RSI remains below 50. The ADX reading of 49.05 points to a strong existing trend, meaning a break of the $60 area could carry more weight.
A bullish path would see silver price reclaim $62, then target $64-$65 and potentially $67. A bearish break below $60 could expose $58 and then $56. The third path is a range between $60 and $63 before either side takes control.
Where Will Gold and Silver Prices Go This Week?
For gold price, the three key paths are bullish: $4,200 → $4,300 → $4,400; neutral: $4,100-$4,200; bearish: $4,100 → $4,050 → $4,000.
For silver price, the three paths are bullish: $62 → $64-$65 → $67; neutral: $60-$63; bearish: $60 → $58 → $56. The key drivers this week remain US yields, the dollar, oil prices and fresh Fed commentary.
Frequently Asked Questions
Subscribe to our YouTube channel for daily crypto updates, market insights, and expert analysis.