XRP price dipped 2.5% amid the ongoing market correction and is now trading around $1.10. The broader crypto market is in the red today, with Bitcoin holding near $65,000 and altcoins giving back some of their recent gains.
But analyst Celal Kucuker, who I like to cover on CaptainAltcoin considering he posts high-quality XRP price predictions, just weighed in on the situation on the XRP/BTC chart. His analysis points to a massive breakout that could send XRP above $12.
What you'll learn 👉
The XRP/BTC Thesis: 10x Outperformance Against Bitcoin
Celal Kucuker believes the XRP/BTC chart is approaching a major moment. The red descending channel that has contained XRP’s performance against Bitcoin for years is close to breaking.
When that breakout happens, he expects Ripple to outperform Bitcoin by 10x from current levels. By the time Bitcoin is printing a new all-time high, XRP will likely already be trading above $12.
The XRP/BTC pair has been in a structural downtrend since the 2018 peak. A pump above the descending resistance would signal that the XRP price is finally gaining strength against the largest crypto.
XRP Chart Analysis: A Multi-Year Compression
The monthly XRP/BTC chart has been in a multi-year downtrend since the 2018 peak. The chart shows a descending resistance trendline connecting the major highs, horizontal support around 0.0000155 BTC, and major resistance around 0.00017–0.00018 BTC. This forms a large descending triangle or compression pattern.
Price is at major support. Price has returned multiple times to approximately 0.000015–0.000016 BTC, and buyers continue defending it. Sellers are struggling to create new lows. Buyers consistently appear at this level. Repeated support tests increase the chance of either a strong bounce or eventually a breakdown if buyers exhaust themselves. Right now, the support is still intact.
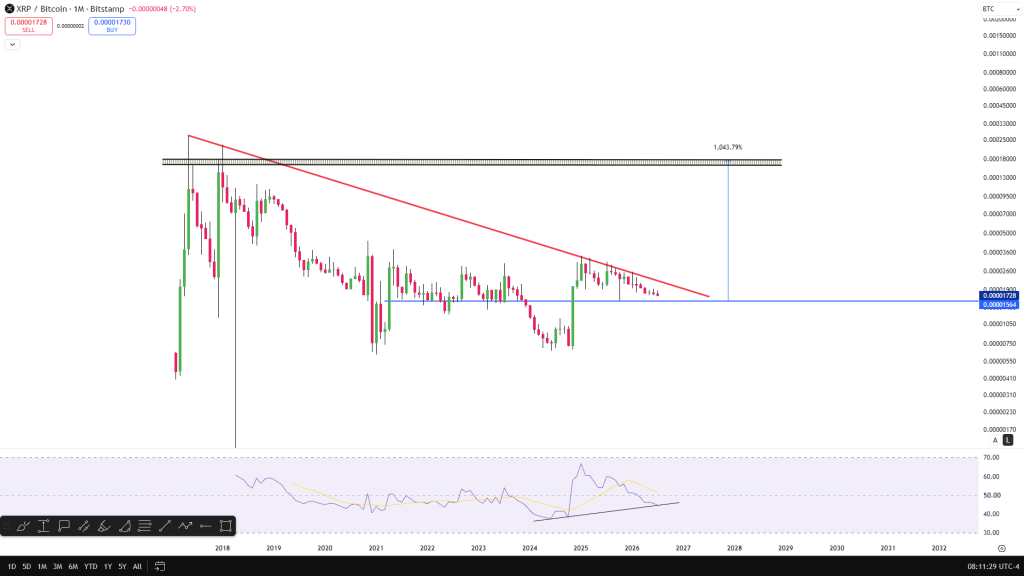
Descending resistance has rejected every rally since 2018. Each rally has produced lower highs, lower momentum, and declining volatility. That confirms the macro bearish trend has not been broken yet. Until price closes above the red trendline on the monthly timeframe, XRP is still underperforming BTC.
RSI analysis shows momentum has cooled, but long-term bullish momentum has not completely disappeared. RSI made a major low in 2024, recovered sharply above 60, and is now drifting back toward 45–50 with a slight rising trendline underneath. If RSI breaks below that rising support, relative weakness against BTC would likely continue. If RSI bounces near 45–50, it would support another attempt at breaking the downtrend.
Compression is reaching its apex. That usually means volatility contracts and a large move becomes increasingly likely. A breakout could happen in either direction, but the closer price gets to the apex, the less room remains for sideways movement.
The upside target of roughly 0.00017 BTC represents approximately a 1,040% move from current levels. That area means previous major resistance, a former distribution zone, and historical liquidity. It is a logical long-term objective after a confirmed breakout.
Read also: XRP Holders: The Clarity Act Is More Important Than the SEC Ruling
Bullish and Bearish Scenarios
Based on what I see on the BTC/XRP chart, here are my bullish and bearish scenarios:
Bullish scenario: Hold 0.0000155 BTC support, break the descending trendline, retest it as support, then accelerate toward 0.00003 BTC, 0.00005 BTC, 0.00008 BTC, and eventually 0.00017 BTC. The key confirmation is a monthly close above the descending trendline, ideally with increasing volume.
Bearish scenario: If support fails below approximately 0.000015 BTC, there is relatively little historical support until much lower levels. That could lead to another leg of XRP underperforming Bitcoin, consistent with the bearish implications of descending triangles if they break downward.
Can XRP Price Really Hit $12?
XRP price could hit $12 in the next bull run, but this would require a massive bull cycle not only for altcoins in general but particularly for XRP. A move to $12 would be almost a 4x from the current XRP all-time high of approximately $3.84. That is not impossible – XRP has delivered similar moves before – but it would require a level of adoption and capital inflows that have not yet materialized.
If we briefly disregard the $12 target, I can say that this is one of the cleaner XRP/BTC charts I have seen. The possibility of a breakout is decent. The support level has held for years. The compression is reaching its apex. The RSI is showing early signs of bullish momentum. The technical setup is favorable. The key is the breakout above the descending trendline.
If the breakout confirms, the move could be significant. The $12 target is ambitious but mathematically possible. For now, I am watching the monthly close above the red trendline. That is the signal that would change everything.
FAQs
Subscribe to our YouTube channel for daily crypto updates, market insights, and expert analysis.