
Several bullish XRP market signals are lining up at the same time. Price action, whale activity, ETF flows, and technical indicators now paint a similar picture. The information they reflect indicates that XRP price could be going higher in the next few days.
Recent data shows large XRP holders continue adding to their positions as smaller wallets reduce their exposure. Fresh ETF inflows have also remained positive, and several technical indicators lean in the same direction.
Another analyst believes XRP has even recreated a chart pattern that appeared before one of its biggest rallies. Together, these developments offer a closer look at where XRP price could move next.
Data shared by BSCN, citing Santiment, shows XRP climbed back above $1.16 for the first time in about 2 weeks. Price recovery came alongside a notable change in wallet activity.
XRP Whales Turn Bullish As Retail Continues Selling$XRP has climbed back above $1.16, a two week high, as large holders continue adding to their positions, per Santiment.
— BSCN (@BSCNews) July 22, 2026
Wallets holding between 100,000 and 100 million XRP accumulated 2.8% more coins over the past five weeks.… pic.twitter.com/gijBc18iCD
Wallets holding between 100,000 and 100 million XRP increased their holdings by 2.8% during the past 5 weeks. Smaller wallets that hold less than 0.01 XRP dropped by 5.2% during the same period.
Large holders often receive close attention because they usually have greater buying power than retail participants. Their accumulation does not guarantee higher prices, although it often reveals confidence during periods when smaller investors choose to exit their positions.
That difference between whale accumulation and retail selling has appeared before during previous market cycles. Market participants often watch these trends because they can reveal whether stronger hands continue building positions before larger price moves develop.
What you'll learn 👉
XRP Whale Activity and ETF Inflows Continue Supporting Market Confidence
Crypto Patel believes another important metric deserves attention.
The analyst noted that whale inflows to Binance have fallen to their lowest level since January 2025. Lower exchange inflows from whales can indicate fewer large holders are preparing to sell their XRP on the open market. Reduced selling pressure can create conditions where new demand has a greater impact on price.
#XRP: Whale Selling Pressure Has Nearly Vanished. The Next Phase Could Be A Powerful Demand-Driven Rally Toward New Highs. 🚀
— Crypto Patel (@CryptoPatel) July 21, 2026
Whale Inflows To Binance Are At Their Lowest Since January 2025.
Long Term Accumulation Zone: Around $1-$0.70
Long Term Target: $10@Ripple NFA & DYOR pic.twitter.com/l5af639GZq
Crypto Patel also identified the area between $1 and $0.70 as a long term accumulation zone. The analyst maintained a long term target of $10, although investors should remember that price targets remain opinions rather than guarantees.
Fresh ETF data shared by Crypto Patel also added another positive signal for XRP.
US spot XRP ETFs recorded inflows of 4.89 million XRP, worth about $5.66 million, during the latest reporting period. Positive ETF inflows often indicate continued institutional interest because fund managers purchase assets to meet investor demand.
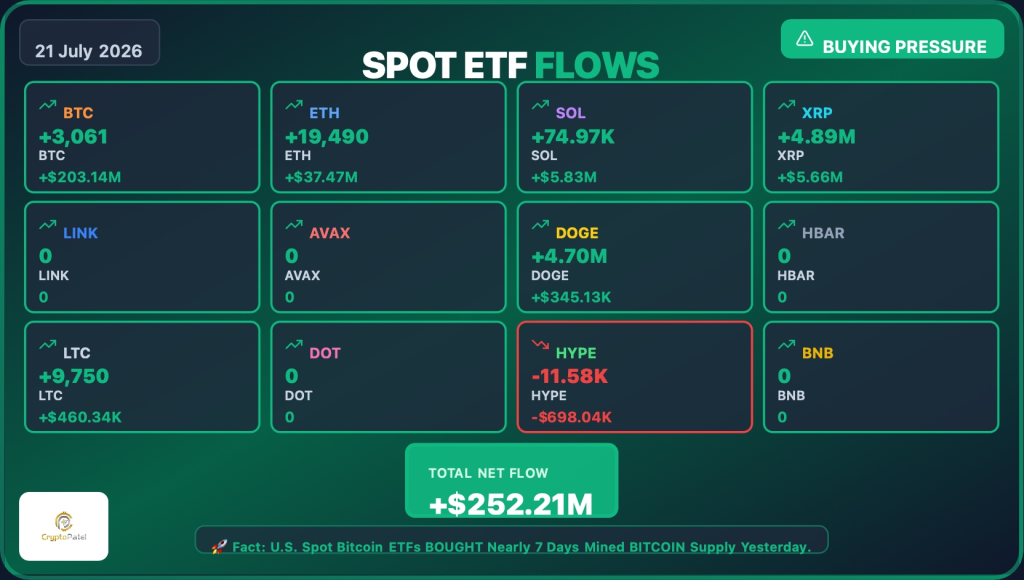
Bitcoin ETFs attracted the largest share of inflows with more than $203 million, although XRP remained among the digital assets that finished the day with positive investment flows.
XRP Price Pattern Resembles a Previous Breakout Setup
Another chart observation comes from analyst MARMOT.
The analyst believes XRP has recreated the same technical structure that appeared during 2024 before XRP price delivered a rally of about 600%. Based on that comparison, MARMOT outlined the following roadmap for XRP price:
- $1.10
- $1.30
- $1.90
- $2.80
- $3.40
Historical chart patterns can offer useful context, although markets never repeat perfectly. Macroeconomic conditions, liquidity, and investor sentiment often differ from one cycle to another. That means similar patterns should be viewed alongside other market signals instead of serving as standalone evidence.
XRP Technical Indicators Continue Leaning Bullish
Price action tells only part of the story. Technical indicators currently offer another perspective, and several of them lean toward buyers.
The Relative Strength Index sits at 54.993. That reading remains neutral because it stays comfortably below overbought territory. Neutral RSI readings often leave room for additional price movement if buying demand continues.
Read Also: Gold Price Warning: Analyst Says $4,100 Pump Could Be a “Trap” – Here’s Why
MACD currently produces a buy signal. Traders often monitor this indicator because it helps identify potential trend changes after momentum begins improving.
The Ultimate Oscillator also gives a buy signal with a reading of 52.944. Rate of Change stands at 4.071 and also favors buyers, which points to improving price momentum over the measured period.
Bull and Bear Power currently reads 0.0586 and remains on a buy signal. Positive readings generally indicate buyers hold a slight advantage over sellers.
| Indicator | Value | Action |
|---|---|---|
| RSI (14) | 54.993 | Neutral |
| MACD (12,26) | 0 | Buy |
| Ultimate Oscillator | 52.944 | Buy |
| ROC | 4.071 | Buy |
| Bull/Bear Power (13) | 0.0586 | Buy |
Several indicators pointing in the same direction do not guarantee the next move. Technical analysis works best when combined with on chain data, ETF activity, and broader market conditions.
FAQs
Subscribe to our YouTube channel for daily crypto updates, market insights, and expert analysis.