
Gold price is back above the psychologically important $4,400-per-ounce level on September 10, with XAU/USD up around 0.5% in early trading. The recovery comes after gold briefly fell below $4,400 earlier this week, as buyers attempt to stabilize the market following the late-August correction.
Fresh market data puts spot gold around $4,414, with a softer U.S. dollar providing support even as Treasury yields remain elevated. Attention is now turning to U.S. inflation data, which could have a major influence on Federal Reserve expectations and gold during Thursday’s session.
The 4-hour chart shows gold trading around $4,424, and while the latest recovery is constructive, bulls still have work to do before the broader technical picture becomes decisively bullish again.
What you'll learn 👉
Gold Price Recovers Above $4,400
The gold chart shows just how volatile gold has been over the past several weeks.
After spending much of June and July around $4,000–$4,200, XAU/USD began a powerful advance in early August. Gold eventually reached approximately $4,650–$4,680 in late August, before sellers took control.
That correction pushed the price toward $4,300 at the beginning of September.
Buyers responded quickly. Gold bounced to almost $4,500, pulled back again toward $4,350 and is now attempting another recovery above $4,400.
This leaves XAU/USD in a short-term consolidation range rather than a confirmed continuation rally.
The chart’s 200-day average sits around $4,541, which is particularly important. Gold is currently trading below this indicator, meaning bulls still need to recover approximately $4,540–$4,550 before the broader setup improves considerably.
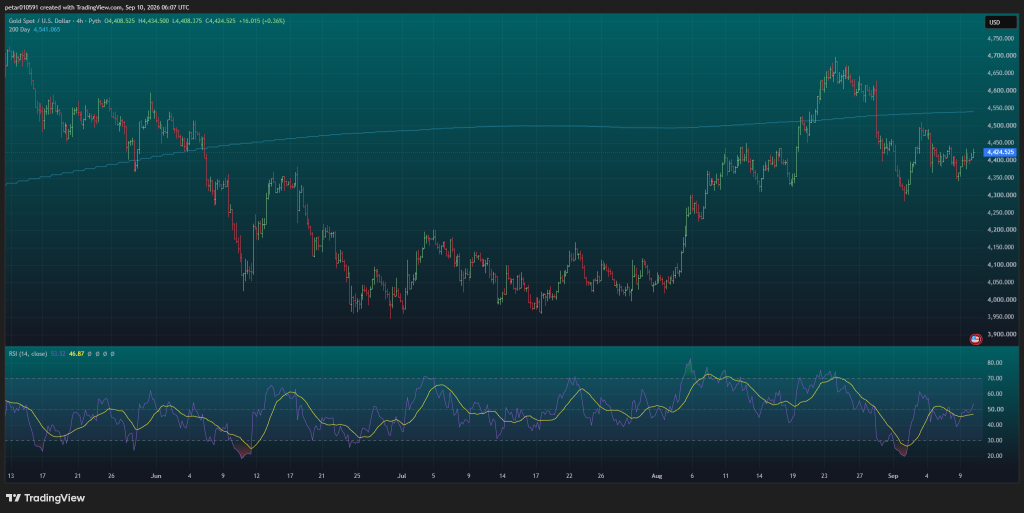
On the other hand, buyers have repeatedly appeared between roughly $4,300 and $4,350. That gives gold a reasonably well-defined support area if today’s recovery fails.
RSI Is Starting to Improve
The Relative Strength Index provides a mildly encouraging signal.
The 4-hour RSI is currently around 53.5, while its accompanying average is near 46.9. The RSI has therefore moved back above the neutral 50 level and above its average.
This indicates that buying pressure has improved following the early-September selloff.
More importantly, RSI isn’t close to overbought territory. The indicator remains well below 70, leaving room for additional upside if buyers continue entering the market.
The previous late-August rally pushed RSI above 70 as gold approached $4,650. By comparison, today’s reading around 53 represents a much more neutral setup.
For bulls, maintaining RSI above 50 would strengthen the case for another attempt at resistance. A drop back below approximately 45 would indicate that sellers are regaining control.
Read also: Gold Price Prediction as China Buying Spree Continues
Gold Price: Support and Resistance Levels to Watch Today
The first immediate resistance is around $4,430–$4,450. Gold has repeatedly traded around this region during the latest consolidation, making it the first obstacle for buyers.
A clean move through $4,450 could put $4,480–$4,500 back in play, but that seems unlikely.
Above there, the biggest technical barrier visible on the chart is approximately $4,540–$4,550, where the 200-day average currently sits. Recovering that area would make a return toward $4,600 considerably more plausible, followed by the late-August high around $4,650–$4,680.
On the downside, $4,400 is the first level to watch.
If gold slips underneath it, approximately $4,350–$4,370 becomes the next support region. Below there, $4,300–$4,320 is the more important defensive zone. Independent technical analysis also places an important support cluster around $4,340–$4,350.
A decisive loss of $4,300 would damage the recovery and could expose the $4,250 area.
Gold Price Prediction for September 10
For today’s session, the chart gives gold a slightly bullish but still cautious setup.
The recovery above $4,400 and RSI’s return above 50 favor another attempt at $4,450. If buyers clear that area, $4,480–$4,500 becomes a reasonable intraday upside objective.
A stronger move would require the gold price to break $4,500 and begin challenging the 200-day average near $4,540–$4,550.
The bearish scenario begins if XAU/USD falls back below $4,400 and cannot quickly recover it. That would increase the probability of another test of $4,350, with $4,300 becoming the larger downside level.
So, for September 10, our base case is continued consolidation with a modest bullish bias while gold remains above $4,400. A $4,450 breakout would strengthen that outlook, while losing $4,350 would put sellers back in control.
There is an important complication today: macro data could easily overpower the technical setup.
What to Watch Today (September 10)
The biggest scheduled U.S. catalyst is Producer Price Index data at 8:30 a.m. ET, alongside initial jobless claims. CPI follows on September 11, so inflation expectations are likely to remain central to gold trading throughout the session.
Traders should watch the U.S. dollar and Treasury yields closely. A stronger dollar combined with rising yields would generally work against non-yielding gold, while a weaker dollar and falling yields would provide a more favorable backdrop. The relationship is particularly important today because the 10-year Treasury yield is around 4.84% after recently reaching its highest level since 2023, yet the dollar has remained relatively subdued.
Geopolitics remains another wild card. The conflict involving the U.S. and Iran has intensified, with attacks on shipping around the Persian Gulf helping push Brent crude above $100. Further escalation could generate additional safe-haven demand for gold, although Reuters notes that the dollar and interest-rate outlook are currently having a greater influence on bullion.
Finally, flows remain worth monitoring. The latest World Gold Council data show that global physically backed gold ETFs attracted $18 billion in August, their second-largest monthly inflow by value on record. Holdings increased by 121 tonnes to a record 4,189 tonnes, while COMEX positioning also became considerably more bullish during the month.
That provides a supportive longer-term backdrop, but today’s battle is much simpler: $4,400 needs to hold, $4,450 is the first upside test, and $4,500–$4,550 is the region bulls ultimately need to reclaim to put the recent correction firmly behind them.
Subscribe to our YouTube channel for daily crypto updates, market insights, and expert analysis.