Cardano (ADA) has shown some promising signs recently. It has managed to reclaim the 30 cent level, marking it as one of the winners in the current market scenario with an upside of more than five percent.
The price movement of ADA has been observed with high interest. It’s important to note that while there are temporary correlations with Bitcoin and other valid coins, these correlations are not a rule and can’t be used extensively for trading as they don’t allow for accurate risk measurement.
Doge2014 raises 500K in days celebrating Dogecoin. Make potentially big profits and get in on exclusive airdrop!
Show more +Currently, ADA is still in resistance, even though it’s pushing against the 30 and a half cent level. The move off the lows is only in three waves so far, which could suggest that this is simply an ABC structure. However, it’s too early to confirm that a low has been made.
There are two potential scenarios at play here. The first is that this is still primarily counted as a wave four, as long as we stay below 30.4 cents. The second scenario comes into play if the price goes above that level. If the price breaks above resistance in three waves, it’s useful to adopt a mindset that questions more imminent downside. However, it’s not yet a signal that a low is in place.
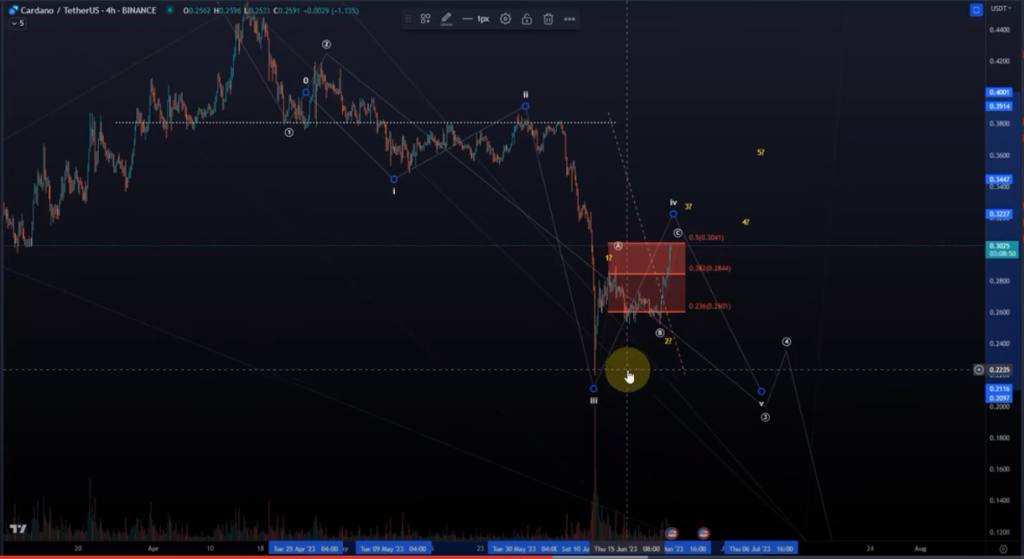
The potential for a bullish count is recognized, especially after a long downtrend after it made a new low. For those interested in trading ADA, a simple strategy could be to go long with a stop below the June low. This is due to the higher rewards risk ratio as the invalidation point or the stop would be very close to the current price.
Looking ahead, if we get five waves up and hold a subsequent pullback in an ABC, we have the next potential long setup. Until then, it’s a bit nebulous because it is just a three-wave move to the upside. A break above 30 and a half cents will put more emphasis on this bullish count and if we get the five waves, the question marks will be removed and then we’re looking for an ABC pullback.
ADA is in a possible trend change situation at the moment. While there is some euphoria in the market and altcoins seem to be waking up, it’s important to be careful. Green candles alone are not enough to confirm a trend change. We need to see five waves up and three waves down to confirm a trend change from an Elliott wave point of view.
Polygon (MATIC) Price Momentum: A Closer Look at the Potential Upside and Bullish Setup
Polygon (MATIC) suggests that the cryptocurrency is in a larger degree bullish setup. As long as the 48 cent level is holding, the bullish setup will not be invalidated. However, probabilities start to shift below the 78.6 Fibonacci retracement level.
Currently, MATIC is moving up in a fourth wave in a three-wave structure and is just going to max out at the resistance area. The idea is that in this C wave, we have a wave one, wave two, wave three, wave four, and wave five. That wave five could be done or could be nearly done, so either one more low or it’s finished.
A potential bullish setup is forming, but it’s a fairly balanced view as long as we only have three waves to the upside. This could be a wave one in the wave two, which is now rallying in a wave three. The wave three should reach the 1.618 extension, so it should reach 85 cents, then we should get a fourth wave and the fifth wave ideally to around 91 to 98 cents.
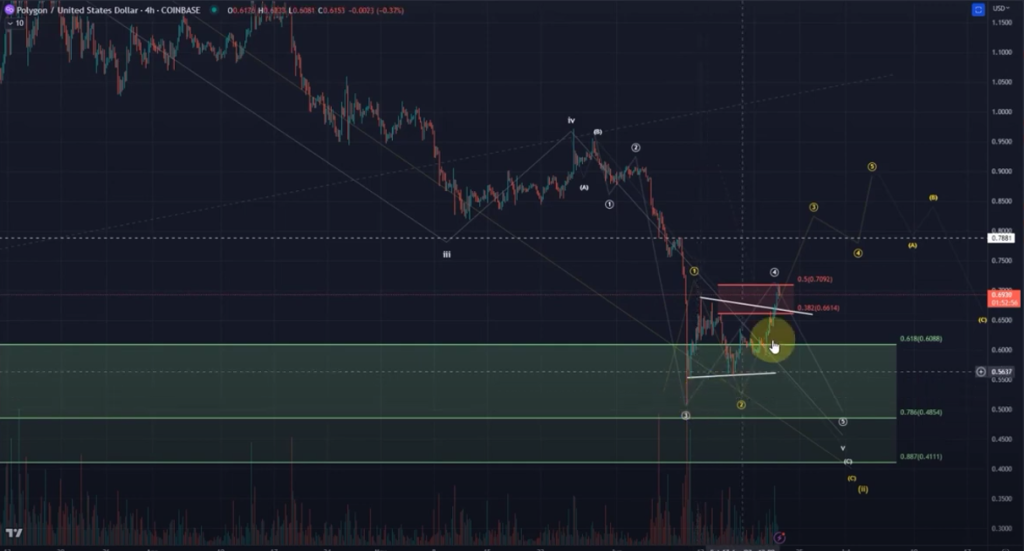
This five-wave move is what we want and need to see, followed by a three-wave move to the downside. As long as we only have three waves, especially as long as we are not above resistance, there is still a lot of downside pressure and another low could definitely happen at any point.
If a five-wave move to the upside occurs, it will increase probabilities that a higher low is holding in a three-wave pullback. Then we have a larger wave one and a larger wave two of the even larger degree third wave.
If we break above the 71 cent level, which is the wave four and the 50 retracement level, it is not so clear anymore that we will be in this imminent downside setup. Above that level, we still only have three waves up but it makes a direct downside move less likely and less reliable. However, we also don’t really have a very clear five-wave move to the upside and not a very clear structure that we can say a low is in.
In conclusion, MATIC is in a possible trend change situation at the moment. While there is some euphoria in the market and altcoins seem to be waking up, it’s important to be careful. Green candles alone are not enough to confirm a trend change. We need to see five waves up and three waves down to confirm a trend change from an Elliott wave point of view.