
Bitcoin Price Warning: Prediction Markets Are Betting Heavily Against $60K Holding


Bitcoin price has spent much of 2026 struggling to establish a clear direction, and prediction market data now points toward another test of its most important support. Polymarket currently gives Bitcoin an 80% chance of falling below $60,000 before 2027.
That figure deserves attention because BTC price is currently trading near $63,900. A relatively small decline would place the market below the psychological $60,000 level and its nearby technical support around $59,000.
Recent Bitcoin price action helps explain that cautious outlook. BTC has remained mainly within the $60,000 range since June, apart from a brief decline toward $57,000. Earlier activity between late January and June kept Bitcoin inside a broader range between $60,000 and $82,000.
The reduced range and repeated failures to begin a lasting recovery have weakened expectations for the remaining months of 2026. However, the Polymarket numbers require careful interpretation because each contract carries different trading volume.
What you'll learn 👉
What the Polymarket Data Shows About Bitcoin Price Expectations
Polymarket’s market asks which price levels Bitcoin will reach before January 1, 2027. Each target operates as a separate contract, which means several outcomes can resolve positively during the same period.
The current probabilities show considerable uncertainty in both directions:
- Bitcoin has an 80% chance of falling below $60,000.
- BTC has a 56% chance of dropping below $55,000.
- A decline below $50,000 carries a 36% probability.
- Bitcoin has a 73% chance of reaching $70,000.
- A move above $75,000 carries a 55% probability.
- Bitcoin has a 33% chance of reaching $80,000.
These numbers do not mean Polymarket expects Bitcoin to finish 2026 below $60,000. The contract only asks whether BTC will touch the specified price before the deadline.
Bitcoin could therefore fall below $60,000 and later recover above $70,000. Both contracts could resolve positively because the outcomes are not mutually exclusive.
The entire Polymarket page shows more than $50 million in trading volume, but that total covers numerous price contracts. The individual markets range from $5,000 to $1 million on the upper side and from $5,000 to $60,000 on the lower side.
Resolution depends exclusively on Binance’s BTC/USDT market. Any final high from a 1 minute candle between November 24, 2025, at 14:00 ET and December 31, 2026, at 23:59 ET must equal or exceed the stated upper target.
Downside contracts use the corresponding lower price condition. Bitcoin prices recorded on other exchanges or through different trading pairs will not determine the outcome. Polymarket opened the market on February 18, 2026.
Thin Volume Weakens the Reliability of the $60,000 Probability
The 80% probability looks convincing at first, but the volume behind that specific contract creates an important limitation. Polymarket’s below $60,000 market has recorded only about $24,025 in volume.
That amount is very small compared with the total market volume above $50 million. Other downside contracts have attracted much greater activity. The below $55,000 contract has approximately $4.8 million in volume, and the below $50,000 contract has about $2.5 million.
Thin liquidity can make a probability more sensitive to a limited number of positions. A few large orders can move the quoted percentage more easily than they could inside a deeper market.
The 80% figure should therefore be treated as market pricing, not a dependable forecast. It shows that available positions lean heavily toward a break below $60,000, but it does not prove that most Polymarket activity supports that outcome.
Volume differences matter across the bullish contracts as well. The $70,000 target has roughly $149,119 in volume, and the $75,000 contract has about $114,919. Those figures remain relatively thin compared with several more distant contracts.
Related Article: Polymarket Traders Give Bitcoin Just a 3% Chance of Hitting $150K This Year – Here’s the Real Chart
Bitcoin’s Native Chart Supports the Bearish Polymarket Outlook
A look at the Bitcoin chart shows that BTC price has declined steadily since its October 2025 record high. The weekly structure still contains lower price levels, and buyers have struggled to produce a convincing recovery.
Bitcoin currently trades near $63,900 and remains close to support around $59,000. A confirmed break beneath that area could open the door toward $50,000. Further weakness below $50,000 could place the next major support close to $43,000.
The chart does not support an entirely bearish reading, however. Bitcoin has consolidated for several weeks, and certain indicators show that downward pressure may be losing strength.
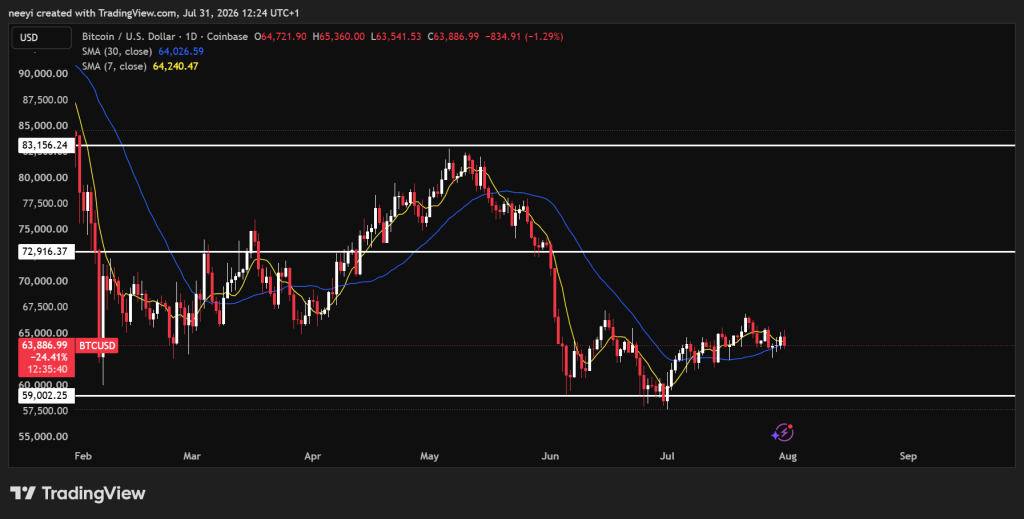
The 7 day and 30 day moving averages remain above BTC price, so they could restrict an early recovery. Bitcoin’s relative strength index remains neutral near 48, and the MACD offers a mildly bullish reading.
Resistance near $65,500 provides the first major test. A recovery above that level could allow BTC price to challenge $70,000 and $72,000. Strong acceptance above $72,000 could create room toward $83,000 before $90,000 becomes realistic.
Current price structure still gives sellers an advantage because Bitcoin trades below both short term moving averages. However, the neutral RSI and mildly positive MACD show that the next direction has not been fully decided.
Bitcoin Price Prediction: What Could Happen Next?
Bitcoin’s next move may depend on whether $59,000 or $65,500 breaks first. Those levels form the immediate boundaries around the current consolidation.
A weekly close below $59,000 would strengthen the bearish Polymarket outlook and make another visit to $55,000 more realistic. Continued selling pressure could then carry Bitcoin price toward the psychological $50,000 support.
Read Also: Ethereum Price Prediction: This Analyst Says $20,000 Is Easier Than You Think
A recovery above $65,500 would weaken the immediate downside case. Bitcoin would still need to reclaim $70,000 and $72,000 before the broader chart begins to look stronger.
Polymarket presents an interesting picture because participants price both a decline below $60,000 and a recovery above $70,000 as probable outcomes. That combination points toward volatility, not necessarily a permanently bearish Bitcoin price prediction.
Technical indicators remain divided, and the $60,000 contract contains limited liquidity. Fundamental news, economic conditions, institutional demand and onchain activity could eventually decide which boundary breaks first. Bitcoin now faces a narrow contest between $59,000 support and $65,500 resistance, and the winner could define its direction throughout the remaining months of 2026.
FAQs
Subscribe to our YouTube channel for daily crypto updates, market insights, and expert analysis.






