
In our last Bitcoin and Ethereum weekly prediction, we mapped out three possible paths for both assets. The Bitcoin price was expected to hold $82,000–$83,000, break $86,000 and retest $87,000–$88,000, or fall toward $80,000 if $82,000 failed.
Ethereum was expected to defend $2,650–$2,700 and challenge $2,800, with $2,600 marking the key bearish threshold.
Bitcoin did reach the $86,000 area, with the chart peaking near $86,800, but it did not reach $88,000. ETH also held $2,650–$2,700 and tested the upper end of its range without clearing $2,800. This week, Bitcoin trades around $84,910.99 with volume down more than 60%, as Ethereum is up 0.67% at $2,693.08.
What you'll learn 👉
What Is Pushing Bitcoin and Ethereum Prices?
Bitcoin has a stronger institutional backdrop going into the new week. U.S. spot Bitcoin ETFs hold about $109.3 billion in combined assets, after attracting roughly $6.3 billion during Q3.
The funds also received $2.4 billion in the week ending September 25, pushing 2026 net flows back into positive territory. BlackRock’s IBIT added another $195.6 million in one session, taking its reported monthly accumulation to $1.57 billion and its holdings above 800,000 BTC.
There are also new instruments that could increase BTC price volatility. The SEC cleared Cboe BZX’s listing rules for six 3x leveraged ETPs, including products linked to Bitcoin and Ether futures, although trading still requires registration effectiveness. El Salvador also received about $138 million from the IMF after waivers tied to Bitcoin accumulation conditions, with the IMF stating that further government accumulation beyond documented private donations is not envisaged.
Ethereum has its own institutional support. U.S. spot ETH ETFs recorded $689.9 million in net inflows in the week ending September 25, following about $140 million of outflows the previous week. ETH ETFs then extended their inflow streak to seven consecutive sessions, including $17.1 million on September 28, before the streak ended with outflows.
The new 3x leveraged Ether products also give traders another regulated vehicle for ETH exposure, though they have not started trading yet.
On-chain activity adds another data point: a whale transferred 20,000 ETH worth about $53.6 million from Bitfinex to an address associated with Aave, leaving the purpose unclear. Ethereum also maintains a 70% 30-day correlation with the S&P 500, keeping broader macro conditions important for the ETH price.
Here’s What the Bitcoin Chart Is Showing
We had a look at the chart, and the BTC price remains above the key $82,000 area after climbing from roughly $76,000 in the middle of September to a recent peak near $86,800. The latest candles show consolidation around $84,000–$85,000 after that move, meaning $86,000–$87,000 is the first resistance zone to watch.
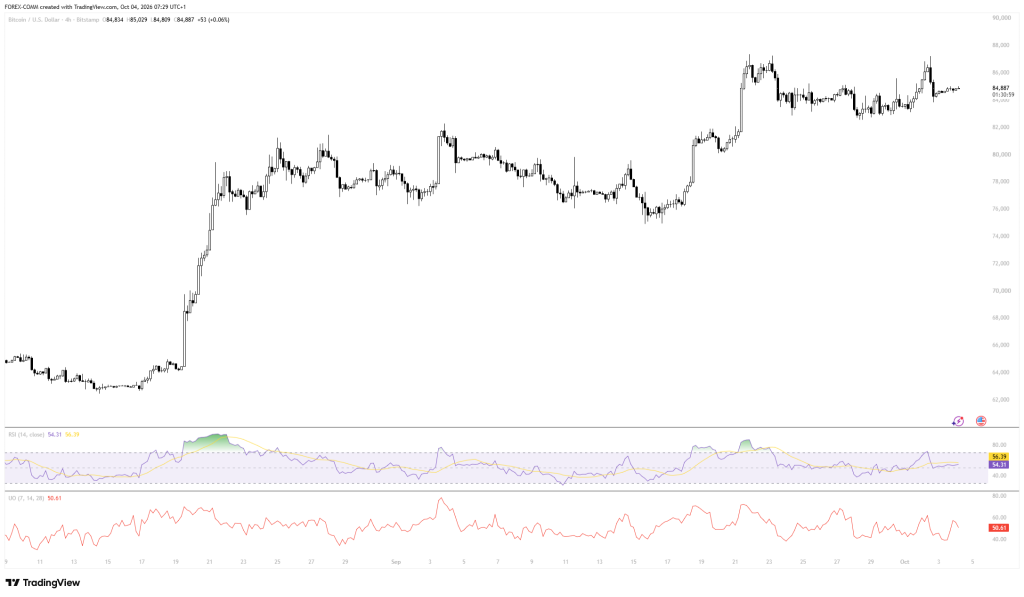
The momentum readings are still constructive but not overheated. Bitcoin’s RSI is 54.31, below its 56.39 signal line, while the Ultimate Oscillator is 50.61. That combination leaves room for another move higher, but the indicator readings do not show the kind of extreme momentum that would confirm an immediate breakout.
For the Bitcoin price, $82,000 is the main downside level from the recent structure, followed by $80,000 and $77,500–$78,000. A move through $86,000 and then $88,000 would reopen $90,000, with $96,700 as the larger resistance area identified from the previous setup.
Here’s What the Ethereum Chart Is Showing
We had a look at the chart, and the ETH price has climbed from around $2,360 in mid-September to a recent high near $2,800.
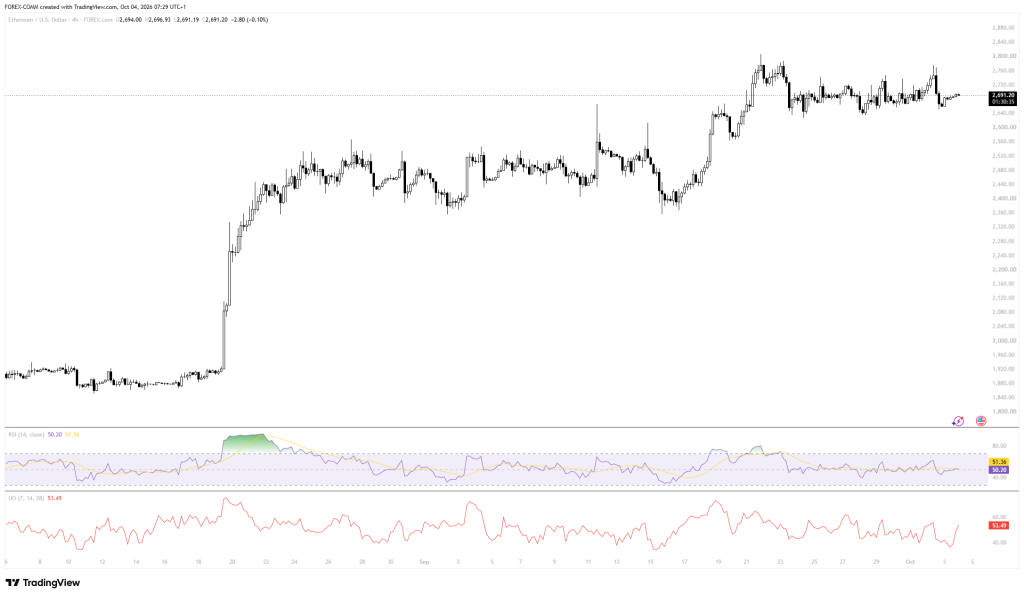
Since reaching that area, Ethereum has traded mostly between $2,640 and $2,760, with $2,700 acting as an important middle point.
The RSI is 50.20, slightly below its 51.36 signal line, while the Ultimate Oscillator is 53.49. These readings are close to neutral, so the Ethereum price needs a clean move above $2,800 to establish stronger upside momentum.
The key support zone remains 2,650–2,700, followed by $2,600. Holding that area keeps $2,800, $2,850 and $3,000 in play, but a break below $2,600 would expose $2,500 and then $2,400–$2,390.
Related Ethereum News: This Analyst Makes a Shocking Ethereum Price Prediction
Where Will Bitcoin and Ethereum Prices Go This Week?
For Bitcoin, the bullish path is a hold above $82,000–$83,000 followed by a break above $86,000. That would put $87,000–$88,000 next, with $90,000 possible if $88,000 breaks.
The neutral path is continued trading between $82,000 and $86,000, and the bearish path is a loss of $82,000, opening $80,000 and $77,500–$78,000.
For Ethereum, the bullish path is a hold above $2,650–$2,700 and a break through $2,800, targeting $2,850 and potentially $3,000.
The neutral path keeps the ETH price between $2,600 and $2,800, matching the recent consolidation. The bearish path begins below $2,600, which would expose $2,500 and then 2,400–2,390.
Frequently Asked Questions
Subscribe to our YouTube channel for daily crypto updates, market insights, and expert analysis.