
Bitcoin price has held close to $84,000 after its latest attempt to climb higher ran into resistance. That pause might look ordinary after a strong move, but a chart shared by analyst Credible Crypto points to a much deeper pullback if BTC cannot clear the area above it.
The warning does not mean Bitcoin will fall straight to $75,000. The analyst’s proposed path includes a period of trading within a narrow range and even a possible move higher before sellers take control. That makes the next move especially tricky to read.
What you'll learn 👉
Bitcoin Price Meets Resistance Above $86,000
Credible Crypto said BTC had tested a key supply zone, as Ethereum had done. A supply zone is an area where selling has previously been strong enough to slow or stop a rise. The analyst expects Bitcoin to form a range on a lower timeframe before a deeper move toward $75,000 to $79,000.
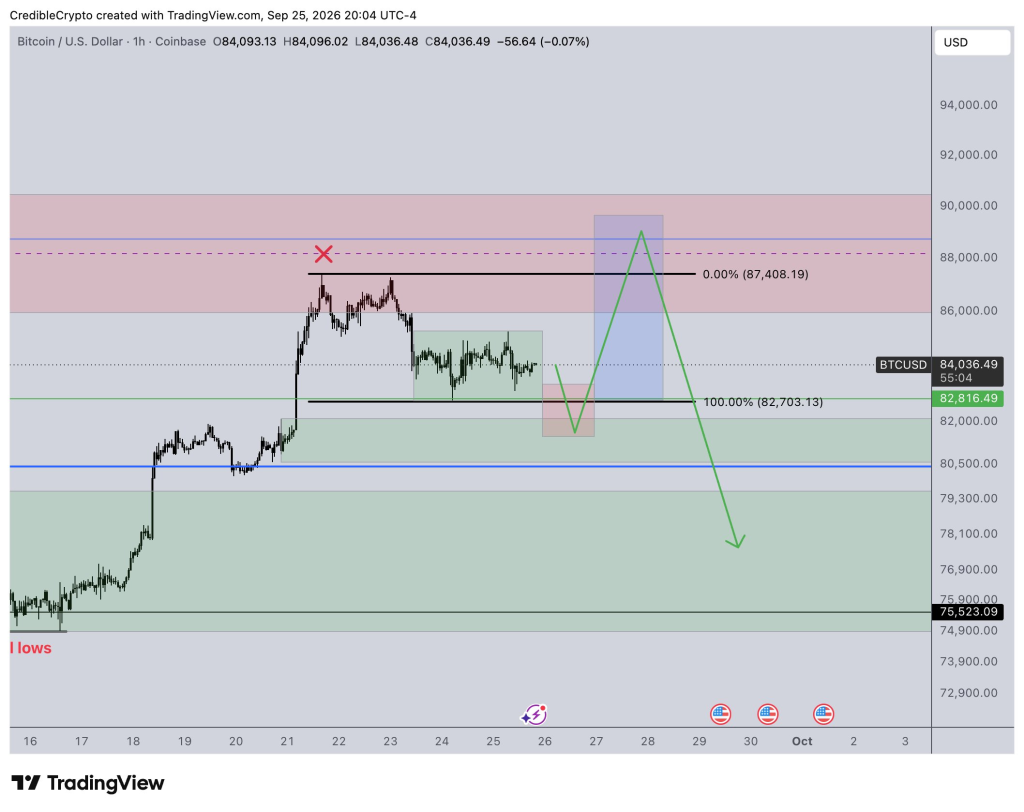
A look at the shared Bitcoin chart shows why that upper area matters. BTC climbed above $86,000 earlier in the week, but its advance stalled beneath the marked level near $87,408. The chart places a broader resistance area above $86,000 and shows Bitcoin back near $84,036 at the time it was captured.
The analyst’s green projection begins with a dip toward the area around $81,000. It then traces a rebound past the recent highs before turning down toward the upper $70,000s. That line is a possible sequence, not a record of price moves that have already happened.
Credible Crypto also mentioned a possible “PO3 setup” near the local highs. Put simply, the idea is that Bitcoin could move above nearby highs briefly, draw in buyers, and then reverse. His comment about fading whichever side of the local range breaks first points to the same concern: the initial breakout might fail.
Several levels stand out on the chart:
- Around $87,408: The marked local high that BTC would need to reclaim before testing the higher supply zone.
- Around $82,703: A marked lower boundary beneath Bitcoin’s recent trading area.
- Around $80,500: Another visible level that could matter if the pullback deepens.
- $75,000 to $79,000: Credible Crypto’s broader downside target area, which includes the marked level near $75,523.
The chart’s most aggressive route takes Bitcoin close to $89,000 before the projected decline. BTC does not need to follow every turn of that drawing for the analyst’s broader warning to remain relevant. The key question is whether a recovery above recent highs can hold.
Bitcoin Price Still Has a Narrower Test Between $83,000 and $85,000
An earlier short term Bitcoin outlook focused on BTC’s movement between $83,000 and $85,000. Bitcoin had spent much of its time inside that range after entering it on Wednesday, with neither side able to take firm control.
That range remains a useful way to judge the immediate move. A break above $85,000 could bring $87,000 into view. Losing $83,000 could instead open a move toward $81,000, followed by $80,000 if selling continues. Continued trading inside the range would leave the next direction unresolved.
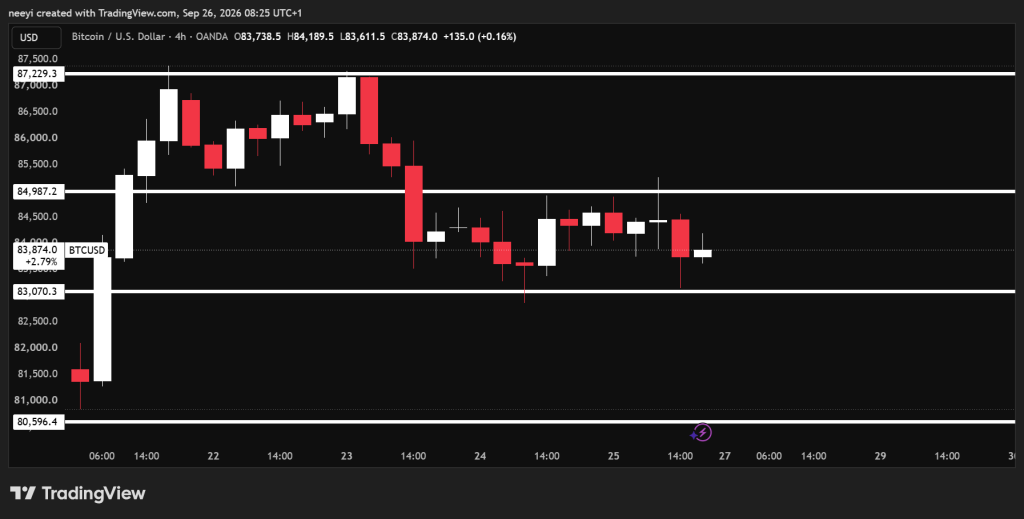
The earlier indicator readings also gave a mixed picture. RSI stood at 51.937, close to neutral, and the MACD remained positive at 597.6. The Ultimate Oscillator read 46.516, however, and Bull/Bear Power stood at -710.324. Those readings did not establish a decisive breakout in either direction.
Credible Crypto’s chart looks further ahead than that immediate range. A move toward $87,000 could satisfy the near term bullish case and still run into the supply zone above it. Conversely, a break below $83,000 would put BTC on a path toward some of the lower levels marked on the analyst’s chart.
Read Also: XRP Price Could Be One Green Week Away From Something Huge!
The difficult part of this setup is the order of events. Bitcoin could first lose the bottom of its current range, rebound toward the recent highs, and only then face the deeper decline Credible Crypto has drawn. It could also break higher and hold above the supply zone, which would weaken the case for his projected reversal.
The $75,000 to $79,000 area is therefore a conditional target. Bitcoin would have to lose several nearer levels before a drop that deep came into focus. The chart shows a possible route through those levels, but it cannot establish that BTC will take it.
FAQs
Subscribe to our YouTube channel for daily crypto updates, market insights, and expert analysis.