
XRP price is trading around $1.55 after pumping 1.5% over the past 24 hours. But according to Patrick L. Riley, the far more important event could come next week.
Riley believes that if XRP finishes next week in the green, the market could be looking at the beginning of another XRP bull run and potentially a broader change in which Bitcoin’s dominance starts to fade. He went as far as describing that scenario as “a whole new market.”
It is an ambitious thesis, but his long-term XRP chart explains why he is paying so much attention to the next weekly candle.
What you'll learn 👉
Why One Green Week Could Fuel XRP
Riley’s weekly chart stretches all the way back to 2013 and places XRP’s major historical cycles inside a series of long-term rising trend channels.
The most important part of the chart right now is much closer to current price.
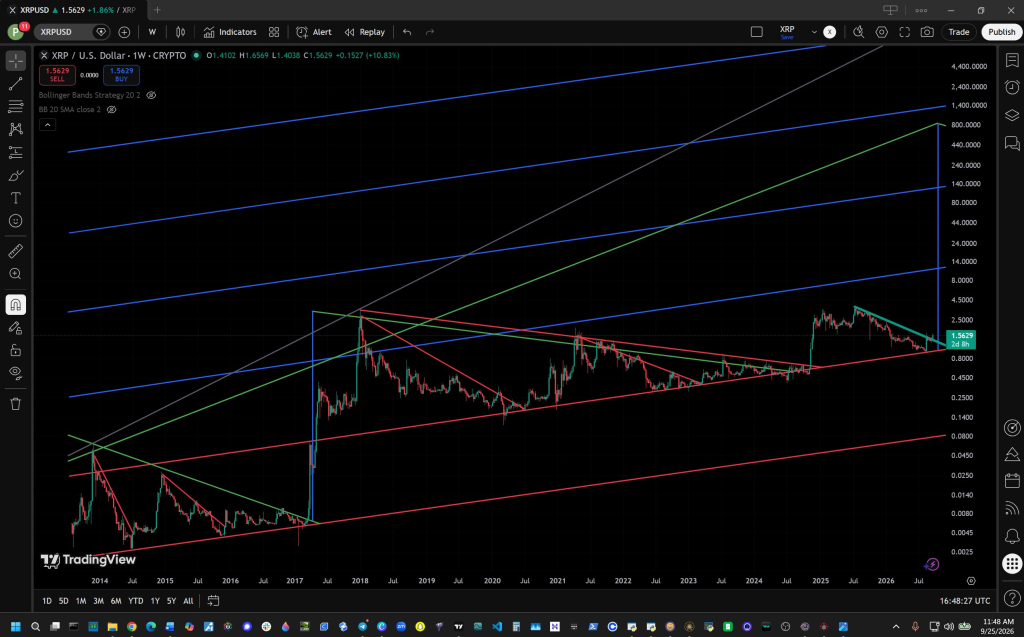
After XRP’s powerful move during 2024 and 2025, price entered a prolonged descending structure. The turquoise resistance line connects the declining highs since the 2025 peak, while a rising red trendline underneath price has provided a longer-term structural floor.
Those two lines are now converging.
XRP is sitting near the point where the descending resistance meets the rising long-term support, creating a technical compression that leaves increasingly little room for price to continue moving sideways.
Riley appears to be watching for a strong weekly close that pushes XRP away from this convergence to the upside. In his interpretation, another green week could provide evidence that the lengthy correction from the 2025 highs is ending.
The chart also shows why the analyst attaches broader market significance to the setup. Previous XRP cycles have included extremely rapid expansions once long periods of consolidation ended.
Still, the enormous blue and green channels extending into triple- and even quadruple-digit XRP prices should be treated as long-term geometric projections rather than realistic near-term targets. The chart does not establish that XRP will reach those levels.
Likewise, an XRP green weekly close by itself would not prove that Bitcoin dominance has ended. Riley is presenting a market thesis based on his chart structure, not a confirmed relationship.
Read also: XRP Price Crash Is Coming, Warns Analyst – But There’s a Twist
Institutional Demand Adds Another Layer
There are also signs of continued institutional interest beneath XRP’s latest recovery.
U.S. spot XRP ETFs have continued attracting capital, with recent reporting putting cumulative net inflows around $1.7 billion earlier this month. Recent ETF data have shown positive demand even during periods when XRP itself struggled to advance, creating an interesting gap between fund flows and price performance.
The latest reporting cited by Finbold puts this week’s ETF inflows at approximately $52.95 million. The same report points to Santiment data indicating large holders accumulated roughly 470 million XRP, valued at more than $700 million, over five days.
Those numbers add context to Riley’s technical thesis, but they should not be treated as guarantees of higher prices. ETF inflows create demand through regulated investment products, while whale-balance changes can have several explanations and do not necessarily translate into immediate buying pressure on exchanges.
Earlier this month, XRP ETFs also recorded an 11-session inflow streak that brought in around $170 million, according to SoSoValue data cited by CoinDesk.
XRP Is Approaching the Real Test
From a shorter-term perspective, the $1.55-$1.60 area is becoming important.
The 7-day EMA is around $1.56 and is converging with the 30-day EMA. Rather than treating that convergence alone as confirmation of a new bullish trend, traders will likely want to see XRP maintain prices above these averages and establish higher closes.
Above the current region, the chart shows XRP still has substantial ground to recover before challenging the major highs established during the previous advance.
The downside matters just as much. Riley’s chart places XRP close to the intersection of its descending resistance and much longer rising support. A failure to hold this structure would weaken the interpretation that XRP is preparing to begin another major advance.
That is why next week’s candle could be unusually informative.
For more crypto news and price predictions, click here.
Subscribe to our YouTube channel for daily crypto updates, market insights, and expert analysis.