
Bitcoin price may have produced one of its most important signals of the current market cycle. A rare setup that appeared near the previous $15,000 bottom has returned, and its timing makes the development difficult to ignore.
Ali Charts has identified 2 bullish Bitcoin signals, each based on a different market indicator. One points toward a possible short-term recovery, and the other raises a much bigger question about whether Bitcoin has already formed another major bottom.
The similarities with the previous cycle look promising, though another long-term Bitcoin price model still leaves room for a much deeper decline. That conflict creates a fascinating setup for BTC over the coming months.
What you'll learn 👉
Bitcoin Price Receives a New Buy Signal From the SuperTrend Indicator
Ali Charts reported that the SuperTrend indicator has turned bullish for Bitcoin again. This indicator follows price direction and helps identify possible changes between bearish and bullish conditions.
A look at the BTC chart shows Bitcoin trading close to $64,656 when the latest buy signal appeared. Price had recovered from an earlier drop toward $61,000, though resistance remained visible between $65,000 and $67,000.
BITCOIN BUY SIGNAL
— Ali Charts (@alicharts) August 5, 2026
The SuperTrend indicator has turned bullish on $BTC. The previous buy signal on July 3 was followed by a 16% rally, from $57,700 to $68,900. https://t.co/pbmksQGCHu pic.twitter.com/C0Q0LWA1s5
The previous SuperTrend buy signal appeared on July 3. Bitcoin traded near $57,700 at the time before climbing to $68,900. That move delivered a 16% rally from the signal area.
Such a repeat would place Bitcoin price near $75,000 if the latest signal produces a similar percentage move from $64,656. Previous performance cannot guarantee the same result, especially because every market setup comes with different liquidity and demand conditions.
Bitcoin must first clear the resistance above $65,000 and maintain its recovery. Failure near that zone could send BTC price back toward $63,000 or the recent area around $61,000.
Bitcoin Net Capital Flows Recreate the Setup Behind the Previous Cycle Bottom
The SuperTrend signal covers the near term picture, though Ali Charts has identified another development with far greater historical importance.
Bitcoin price has formed a bullish divergence against Net Capital Flows. Price has moved lower across the measured period, but the capital flow reading has formed a higher low below the neutral line.
BITCOIN MARKET BOTTOM
— Ali Charts (@alicharts) August 5, 2026
The last bullish divergence between the $BTC price and Net Capital Flows marked the cycle bottom.
What followed was a bull run from $15,000 to $126,000.
The same signal is back. https://t.co/SxJ0w635qE pic.twitter.com/suckGSld8s
Ali Charts noted that the last comparable divergence marked Bitcoin’s previous cycle bottom. BTC traded near $15,000 before starting the advance that eventually carried Bitcoin price to $126,000.
The same divergence has now returned. Net Capital Flows remain negative, but the latest low appears less severe than the previous one. Bitcoin price has moved lower during that period, which creates the bullish disagreement between both measurements.
Net Capital Flows estimate whether money is entering or leaving the Bitcoin market. Improving flows during a price decline can show that selling pressure is losing strength. Buyers may gradually absorb available supply before price confirms any larger recovery.
This setup does not mean Bitcoin must repeat its journey from $15,000 to $126,000. It does show that the conditions around capital movement resemble those found near the previous major bottom.
Bitcoin Price Still Faces a Possible Drop Toward $40,000
Another long term signal presents a more cautious Bitcoin price outlook. Bitcoin has repeatedly rebounded from a major trend line that has guided its broader market structure since 2019.
The trend line produced notable reactions around 2020 and 2022. Those rebounds later developed into major Bitcoin rallies, and some eventually carried BTC toward new all time highs.
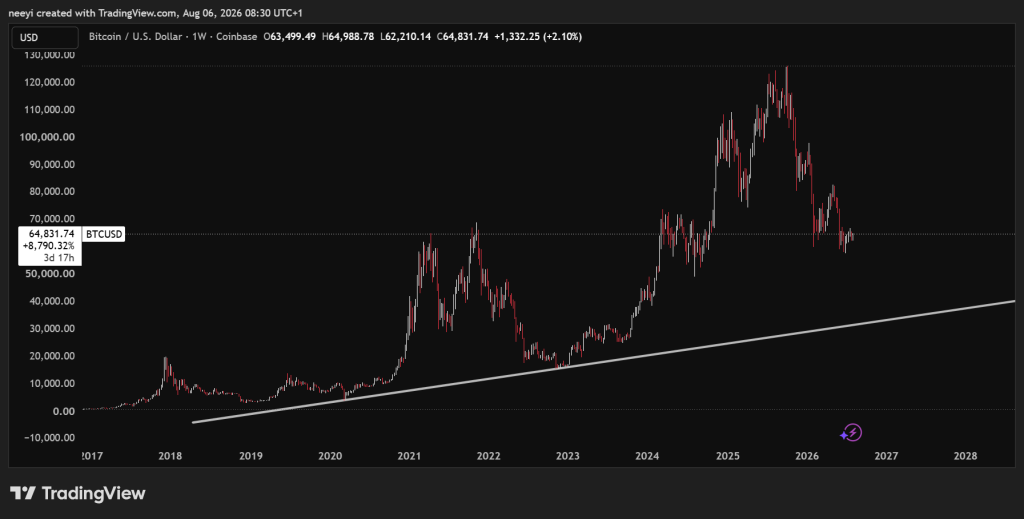
Current Bitcoin price remains close to 50% above that historical trend line. Therefore, BTC could still record further declines before reaching the same support area that produced earlier recoveries.
The model places a possible Bitcoin bottom around $40,000 or slightly below that level. Bitcoin may spend several days under pressure before any larger bullish phase begins. Smaller dips could appear first, followed by a deeper test if buyers fail to defend the current range.
Two different possibilities now deserve attention. Ali Charts’ capital flow divergence may mean the major bottom has already arrived. The historical trend line model leaves open a decline toward $40,000 before the next major recovery develops.
Read Also: Trader Who’s 50% Allocated to XRP Reveals His Next Buy Target
Bitcoin Price Must Confirm Which Bullish Signal Matters Most
Bitcoin currently has a bullish SuperTrend reading, an improving capital flow divergence, and a long term support model that remains much lower. Those signals cover different timeframes, so they do not necessarily cancel each other.
A recovery above $68,900 would strengthen the near term bullish case. Continued weakness below $61,000 would make the deeper trend line increasingly relevant, especially if capital flows begin deteriorating again.
Bitcoin climbed from $15,000 to $126,000 after the previous Net Capital Flows divergence. The same signal has returned, though confirmation still depends on what BTC price does next.
FAQs
Subscribe to our YouTube channel for daily crypto updates, market insights, and expert analysis.