
Bitcoin and Ethereum enter the new week trading around $83,000 and $2,500, respectively, after both assets absorbed another volatile stretch.
Our previous weekly forecast identified $82,000 to $86,000 as Bitcoin’s neutral range, and BTC has remained inside that zone.
For Ethereum, we noted that a break below $2,600 would expose $2,500 and then $2,400-$2,390. That bearish scenario played out, with ETH briefly dropping to about $2,405 before recovering toward $2,500.
The question for this week is whether those rebounds can develop into something stronger.
What you'll learn 👉
Bitcoin Price Analysis
Bitcoin’s two-hour chart shows BTC falling from highs around $87,250 earlier in October to a local low near $80,345 on October 8.
Buyers reacted strongly from that level, sending BTC back above $82,000 and eventually toward the current $83,000 area.
The recovery is constructive, but price has not yet broken the broader short-term structure.
BTC spent several sessions trading above $84,000 before the sell-off, making $84,000-$85,000 the first significant resistance area.
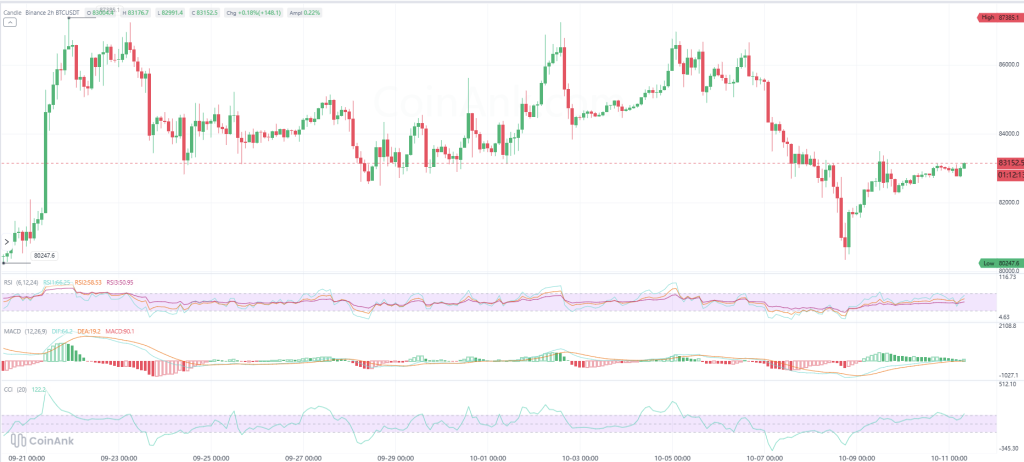
Above that, $86,000 becomes the larger test. A move beyond $86,000 would put the recent $87,250 high back into focus.
Support begins around $82,000. If that fails, $80,000-$80,500 becomes the key downside zone again.
| Bitcoin level | Importance |
|---|---|
| $80,000-$80,500 | Major short-term support |
| $82,000 | First support |
| $83,000 | Current price area |
| $84,000-$85,000 | First major resistance |
| $86,000 | Key bullish recovery level |
| $87,250 | Recent high |
Bitcoin Indicators Are Improving
Bitcoin’s momentum indicators have recovered noticeably after the October 8 low.
The shorter RSI is around 60.4, the medium reading is near 55.8 and the longer RSI is close to 49.7.
That means short-term momentum has turned positive, but the larger momentum picture remains close to neutral.
MACD has also improved. The faster line is above the signal line and the histogram is positive, confirming that the rebound still has momentum behind it.
However, the positive histogram bars have become smaller. That indicates the pace of the recovery is slowing.
CCI is near 92, close to the +100 level that marks strong positive momentum.
Overall, Bitcoin’s indicators favor the bulls slightly in the short term, but BTC needs to move through $84,000-$85,000 to prove this is more than a relief rebound.
Ethereum Price Analysis
Ethereum had a more damaging week.
ETH traded around $2,700 early in the period before selling accelerated and price dropped through $2,600 and $2,500.
The decline eventually reached approximately $2,405.
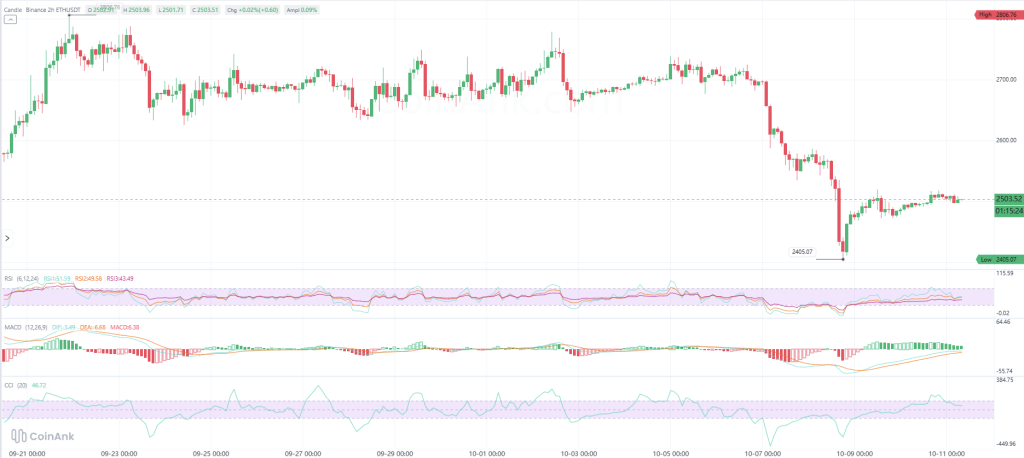
Buyers defended that area aggressively, producing a rebound toward $2,500. ETH has since entered a tight consolidation close to that level.
The first support now appears around $2,470-$2,480.
Below that, $2,400-$2,420 becomes the major zone to defend.
On the upside, $2,550-$2,600 is the first meaningful resistance region. Ethereum spent significant time above this area before the latest collapse, so reclaiming it would improve the structure considerably.
Beyond $2,600, the next area is around $2,650-$2,700.
| Ethereum level | Importance |
|---|---|
| $2,400-$2,420 | Major support |
| $2,470-$2,480 | Immediate support |
| $2,500 | Current psychological level |
| $2,550-$2,600 | Main recovery zone |
| $2,650-$2,700 | Larger resistance |
Ethereum Momentum Is Recovering Slowly
Ethereum’s RSI readings are less impressive than Bitcoin’s.
The short RSI is around 51.6, the medium reading is approximately 49.6 and the longer RSI is near 43.5.
That leaves ETH close to neutral in the short term, with the longer reading still weak.
MACD is improving.
The faster line has moved above the signal line and the histogram remains positive after the rebound from $2,405.
But just like Bitcoin, the green histogram bars are shrinking.
That tells us bullish momentum is losing some strength as ETH approaches $2,500.
CCI is around 47, which is positive but not particularly strong.
Ethereum therefore looks more fragile than Bitcoin heading into the new week.
Read also: If You Invested $10,000 in Bitcoin and Gold When the US-Iran War Started: Here Are the Results
Bitcoin and Ethereum Price Predictions for This Week
Both assets have recovered from their recent lows, but neither has fully repaired the technical damage from last week’s sell-off.
| Asset | Bullish scenario | Neutral scenario | Bearish scenario |
|---|---|---|---|
| Bitcoin | BTC clears $85K and targets $86K-$87.3K | Trades between $82K and $85K | $82K fails, bringing $80K-$80.5K back into focus |
| Ethereum | ETH reclaims $2,550-$2,600 and targets $2,650-$2,700 | Trades between $2,450 and $2,600 | $2,450 fails, exposing $2,400 and potentially $2,350-$2,390 |
For Bitcoin, the weekly structure is relatively straightforward.
Holding above $82,000 keeps the rebound alive. A move through $85,000 would give buyers a real chance to retest $86,000-$87,250.
If $82,000 fails, another test of $80,000 becomes likely.
Ethereum has a tougher task.
ETH needs to reclaim $2,550-$2,600 before the current move can be treated as a stronger recovery.
Until that happens, another visit to $2,450 or even $2,400 remains possible.
For more crypto news and price predictions, click here.
Subscribe to our YouTube channel for daily crypto updates, market insights, and expert analysis.