Bitcoin started May with a solid move upward. Price jumped 2% and climbed back above $77,000. Earlier this week, BTC dipped below $76,000. Buyers stepped in fast and pushed the market up.
We have fresh Bitcoin news to cover today. Let’s get into it.
What you'll learn 👉
Bitcoin ETFs Turn Positive as Bhutan Government Continues to Sell BTC
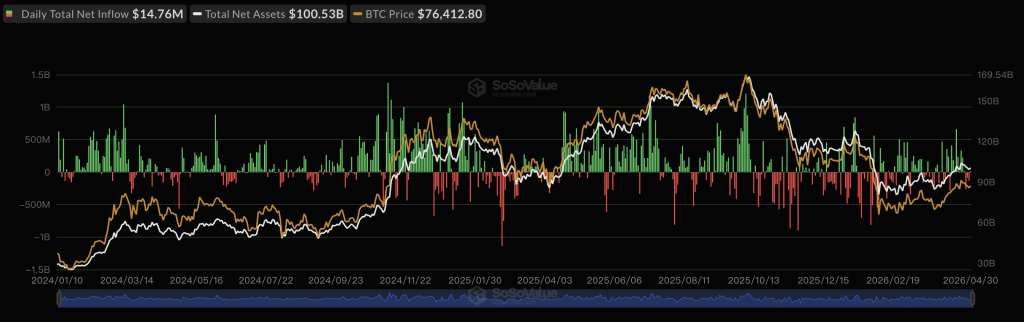
On April 30 (ET), Bitcoin spot ETFs saw a total net inflow of $14.76 million. That’s the first net inflow after three straight days of net outflows. Ethereum spot ETFs did the opposite. They recorded a net outflow of $23.64 million. That’s four consecutive days of outflows for ETH funds.
Analyst Daan Crypto Trades looked at the old saying “Sell in May and go away.” He checked Bitcoin’s historical data. May ranks as the 6th best month by average return. By median return, May ranks 3rd best. Yes, there have been sell-offs (2021 is the main example). But overall, Bitcoin shows no clear seasonality to support that saying.
What is true: starting in May and moving into summer usually brings lower volatility and slower price action. Daan shared the monthly return chart to prove the point.
Bhutan is still moving Bitcoin out of its state wallet. Around $287 million worth of BTC left the Royal Government wallet in the last 20 hours, according to Arkham data.
Arkham estimates that at the current selling pace, Bhutan could run out of its entire Bitcoin holdings by October 2026.
Bitcoin Price Outlook and Predictions
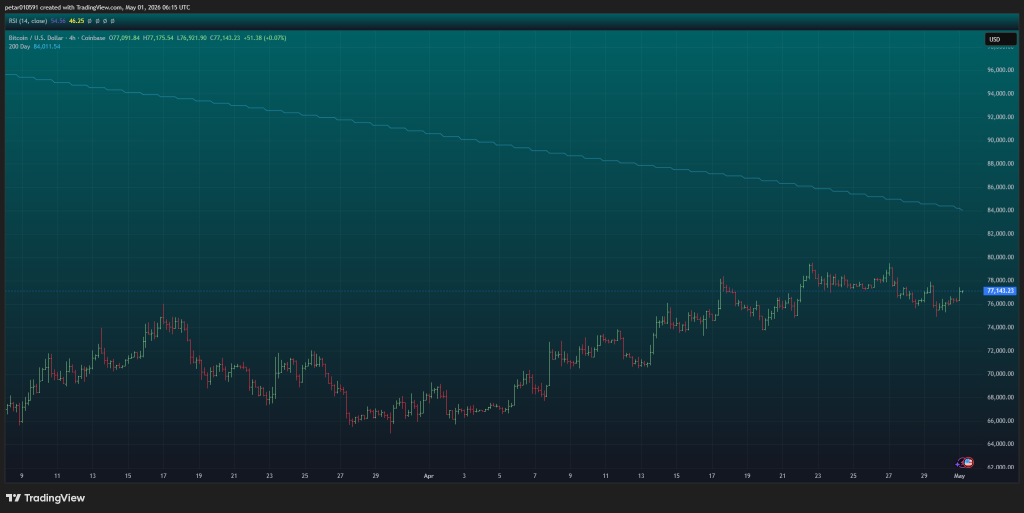
Let’s look at the 4-hour chart.
The Bitcoin price shifted from a downtrend in March into a higher-high / higher-low structure in April. Current price sits near $77,100. The market is now in a range after a bullish recovery. This is not a strong trend phase.
Translation: trend is mildly bullish, but momentum is slowing.
Related news: Bitcoin and Ethereum at Risk as CLARITY Act Stalls
Bitcoin Price Action:
- Downtrend (mid–late March): lower highs, lower lows. Bottom formed around $65K–$66K.
- Reversal (early April): strong impulsive move up. First key breakout from $70K to $73K.
- Trend continuation (mid-April): clean higher highs into $75K → $78K → $79K peak.
- Current phase (late April → now): range and consolidation. Price stuck between $75K and $79K.
Bitcoin Price: Key levels and Indicators to Watch
Support zones:
- $75K–$76K – immediate support, held multiple times.
- $72K–$73K – stronger structural support.
- $69K–$70K – major breakout base.
Resistance zones:
- $78K–$79K – current ceiling, multiple rejections.
- $80K–$82K – psychological level plus liquidity zone. Above that, open air toward $85K and higher.
The 200 moving average sits well above price at $84K and slopes downward. Bitcoin is still below macro trend resistance. Every rally approaches overhead supply. That explains why $78K–$79K keeps rejecting price.
RSI is around 46. Neutral zone. No overbought or oversold edge. Momentum cooled after the rally.
Buyers defend dips, that’s bullish. But they can’t break resistance, that’s bearish pressure. This is compression before a move.
Bitcoin Price Scenarios
Bullish scenario
Break and hold above $79K. Targets: $82K, then $84K (200 MA test). If momentum builds, $88K–$90K becomes possible. But this requires volume expansion. Volume is missing right now.
Bearish scenario
Lose $75K support. Targets: $73K, then $70K. Worst case: retest the $67K–$68K liquidity zone. If $75K breaks, Bitcoin’s downside can move fast because support is thin.
Most likely scenario (short-term)
Continued range between $75K and $79K. Fakeouts on both sides are likely. The market is coiling, not trending.
Bitcoin Trading tips
Range strategy works best now. Buy near $75K–$76K. Sell near $78K–$79K. Use tight stops below the range.
Breakout strategy: go long only after a clean break and retest above $79K. Avoid chasing wicks.
Price sits below the 200 MA resistance. This is not a clean bull market yet. Many traders get trapped here thinking a breakout is guaranteed. Don’t be one of them.
FAQs
Subscribe to our YouTube channel for daily crypto updates, market insights, and expert analysis.