
Geopolitical tension between the US and Iran has continued to shape Bitcoin price action, and recent movements show a market that remains strong but not fully secure. BTC price reacted sharply after the first strikes on Feb 28, dropping about 8.5% into the lower $60,000s before recovering above $73,000 within a week.
That quick rebound changed the tone of the market. Bitcoin began forming higher lows throughout March, which often shows buyers stepping in earlier during each pullback. That pattern helped BTC climb steadily toward the upper $70,000 range, where it now trades close to $78,300 in late April.
Price has largely remained between $60,000 and the higher range of the $70,000s during this period. That range shows stability on the surface, though it also reveals that Bitcoin has not fully broken into a new expansion phase.
Another detail worth noting is how BTC has held up better than traditional markets during this conflict, which continues to support its growing role as a hedge during global uncertainty.
What you'll learn 👉
Bitcoin Chart Analysis By Crypto Patel Shows Key Resistance Levels That Could Trigger A Drop
Crypto Patel’s BTC chart analysis explains why Bitcoin is struggling near current levels despite its recovery. BTC price reclaimed the $79,425 level after several months below it, which signals that short term structure has improved. That said, price is now testing a critical resistance zone.
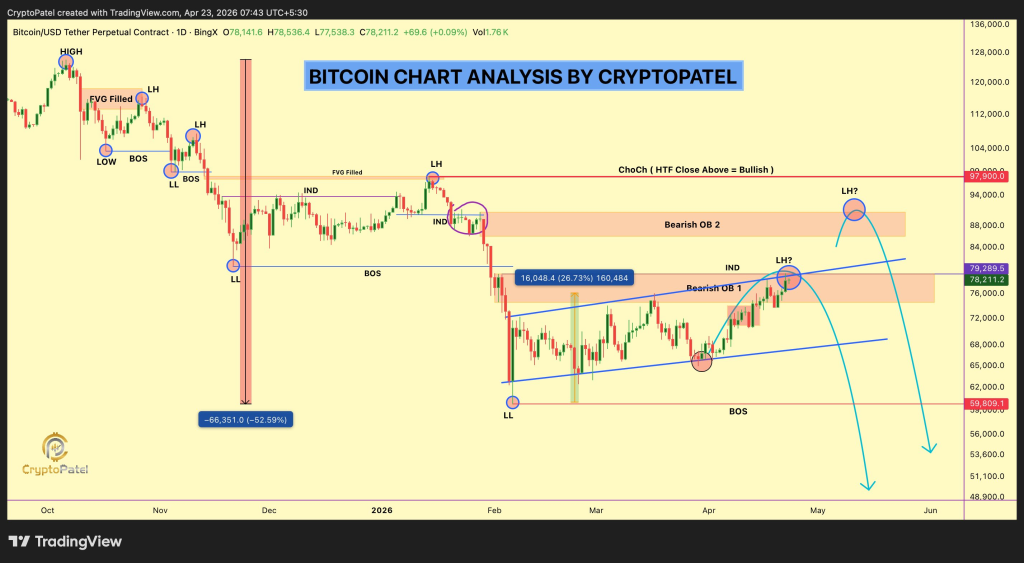
The chart identifies $80,000 as a bearish order block and $90,000 as a higher resistance level. BTC is currently pressing into the lower zone, and the reaction here matters more than the move itself. A daily close above this region could open the path toward $90,000, though failure to break through may lead to another move lower.
Crypto Patel also pointed out that rejection at $80,000 could lead to another sweep lower. That aligns with the visible structure on the chart, where liquidity rests below recent lows. If price fails to hold above this reclaimed zone, BTC could revisit support areas closer to $70,000 or even lower levels.
Tony Research Warns Bitcoin Could Still Follow A 2022 Style Bull Trap Pattern
Tony Research presents a more cautious outlook that suggests the current recovery may not be the final move higher. The analysis compares the current structure to the 2022 cycle, where Bitcoin moved through a relief rally before reaching its actual bottom.
🚨 BULL TRAP $BTC ENDING!
— Tony Research (@TonyResearch_) April 22, 2026
The final phase of the bear market is closer than you think.
Bitcoin has just entered the relief rally – the same bull trap as 2022:
Phase 1: Crash (-54%) → DONE
Phase 2: Fake recovery → WE ARE HERE
Phase 3: Real bottom → LOADING
Retail is buying,… pic.twitter.com/cQFrRdrrTS
The idea follows a three-phase structure. The first phase involved a sharp crash, which had already occurred earlier in this cycle.
The second phase represents a recovery that brings buyers back into the market, and this appears to be where BTC stands now. The third phase would involve a deeper drop that clears remaining positions before a more stable bottom forms.
This view introduces the possibility that Bitcoin could see one more painful drop before a stronger trend develops. Current price strength near $78,000 does not remove that risk, especially if resistance continues to hold.
US-Iran Peace Talk Uncertainty Adds Another Layer Of Risk To Bitcoin Price
Uncertainty around the next round of US-Iran peace talks adds pressure to the broader market outlook. Statements from Tehran indicate hesitation, with officials pointing to a lack of seriousness from the US.
Iran has also set conditions that include lifting the naval blockade of the Strait of Hormuz before talks can move forward. Internal divisions add more complexity, as some leaders support participation if certain conditions are met, while others oppose engagement under current circumstances.
The US has extended the ceasefire deadline, which gives both sides time to respond. That extension does not remove the underlying tension. Any escalation could quickly affect global markets, and Bitcoin often reacts to such developments.
Read Also: Crypto Price Prediction for Today, April 23: Kaspa (KAS), XRP and Solana (SOL)
Geopolitical pressure tends to create sharp movements across risk assets. Bitcoin has shown strength during parts of this conflict, though an escalation could still push BTC price lower as liquidity conditions tighten and risk appetite weakens.
Global events will likely influence that outcome. Bitcoin has managed similar periods of tension before, though each situation unfolds differently.
FAQs
Subscribe to our YouTube channel for daily crypto updates, market insights, and expert analysis.