Bitcoin has outperformed the S&P 500 on just 37.8% of sessions on a rolling measure tracked by Glassnode, marking the lowest share in roughly six years.
The chart shows a clear deterioration in Bitcoin’s relative-performance consistency. During 2023 and early 2024, BTC won roughly 50–60% of sessions at various points. Throughout 2025, the measure spent increasing amounts of time below the 50% “even split” line. By 2026, it weakened further, eventually reaching the current 37.8% level.
What you'll learn 👉
The Data: A Striking Divergence
This is striking because Bitcoin remains dramatically ahead over the full period shown. Since the chart’s starting point, BTC is up approximately 414% , compared with 130% for the S&P 500.
So you have a compelling divergence:
- Bitcoin is still the long-term winner.
- But lately, the S&P 500 has been the more consistent winner.
Those are not contradictory. Imagine BTC loses -0.5%, -0.8%, and -0.4%, and then wins +5%. Bitcoin lost three out of four sessions yet still produced the superior cumulative return.
That is essentially why frequency of outperformance and magnitude of outperformance are different things. Bitcoin can lose to stocks more frequently while still generating much larger gains when it does outperform.
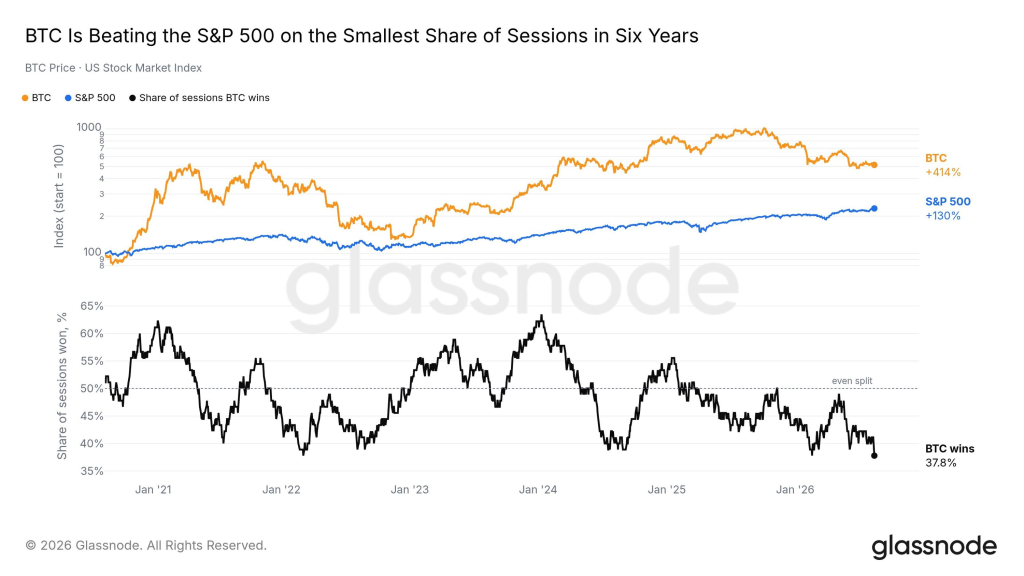
The chart indicates something more interesting than Bitcoin simply having a bad few months. Historically, Bitcoin compensates investors for its enormous volatility with outsized upside. You do not necessarily need BTC to outperform stocks every day if the winning days are substantially larger.
But the 37.8% figure shows that the frequency of those winning sessions has been deteriorating. And that fits the wider 2026 environment. Glassnode has described Bitcoin as spending extended periods below important investor cost bases, with weak institutional demand and subdued trading activity during parts of the year. In July, daily trading volume was around $650 million to $950 million, approximately 80% below the October 2025 peak.
Read also: Bitcoin vs. Gold: Is Saylor’s “Deep Freezer” Theory Being Tested?
The Bigger Question: Is Bitcoin Becoming More Like a Traditional Risk Asset?
Institutionalization has increasingly connected Bitcoin to the same macro forces affecting equities: liquidity, interest rates, the dollar, monetary policy, and general risk sentiment. Glassnode itself highlighted this development when expanding its traditional-finance data coverage in 2026, noting that Bitcoin’s price is increasingly influenced by those traditional macro variables.
That creates an interesting problem. If Bitcoin increasingly trades according to the same forces as equities while simultaneously failing to outperform equities consistently, investors can start questioning what they are being compensated for by accepting Bitcoin’s much greater volatility.
That does not mean the Bitcoin investment thesis is dead. In fact, Glassnode reported as recently as July that Bitcoin managed to outperform major equity indices for two consecutive weeks during one recovery. Rather, the 37.8% figure signals that BTC currently has a relative momentum problem.
The Takeaway
Bitcoin has not lost its long-term edge. It is struggling to demonstrate that edge consistently right now.
The +414% versus +130% cumulative performance demonstrates why investors historically tolerated Bitcoin’s volatility. The 37.8% session win rate demonstrates why the current environment feels different. And the fact that the win rate has fallen to its weakest level in about six years gives the news hook.
Bitcoin’s relative performance against U.S. equities has deteriorated sharply, with BTC now beating the S&P 500 in just 37.8% of sessions on Glassnode’s measure – the lowest share in roughly six years.
For more crypto news and price predictions from CaptainAltcoin, click here.
Subscribe to our YouTube channel for daily crypto updates, market insights, and expert analysis.