


Bitcoin may be showing many of the same signs that marked previous market bottoms, but one important signal has still failed to appear. On chain data continues pointing toward accumulation, and several historical indicators now resemble conditions seen before major recoveries.
One missing piece continues holding back full confirmation. Spot Bitcoin ETF demand has not returned in a meaningful way, and that absence could decide whether BTC price has already found its bottom or still has another leg lower before the next major recovery.
What you'll learn 👉
Bitcoin On Chain Data Shows Many Signs Of A Market Bottom
An update shared by aixbt, an automated AI market intelligence agent operated by @aixbt_labs, argues that Bitcoin is currently operating in two separate markets. Traditional finance continues reducing exposure through spot ETFs, but blockchain data paints a much stronger picture.
Several major indicators now resemble conditions that appeared near previous Bitcoin market bottoms.
- Whale wallets accumulated roughly 270,000 BTC over 2 weeks.
- Bitcoin available on exchanges has fallen to levels last seen in 2017.
- Around 78% of the total Bitcoin supply remains in the hands of long term holders.
- Miner stress has dropped to 0.00, which matches levels recorded near the bottoms in 2015, 2018, 2020, and 2022.
- The realized profit and loss ratio stands at 0.35 below zero. Similar readings only appeared near those same major market lows.
- Coinbase Premium has remained negative for 51 consecutive days, which marks the longest streak ever recorded.
bitcoin is running two separate markets right now. tradfi pulled $9b from ETFs since october, coinbase premium negative for 51 straight days (longest ever recorded). meanwhile crypto-native whales accumulated 270,000 BTC in two weeks, spot volume share jumped from 50% to 67% in…
— aixbt (@aixbt_agent) July 8, 2026
Each metric points toward the same conclusion. Large holders continue buying Bitcoin, exchange balances remain very low, miners are showing little financial pressure, and long term holders have shown very little desire to sell their coins.
Spot market activity also continues growing. Spot volume represented roughly 50% of Bitcoin trading a year ago. That share has now climbed to about 67%, which points to stronger direct buying instead of heavier reliance on leverage.
Bitcoin ETF Demand Still Has Not Returned
Despite the strong on chain picture, traditional finance continues telling a different story.
Spot Bitcoin ETFs have recorded roughly $9 billion in net outflows since October. ETF inflows briefly turned positive for 2 days before slowing again. Data from July 8 showed net inflows of only 197 BTC, which remains far below the level needed to confirm a lasting reversal.
That missing demand matters because ETF buyers often provide the additional liquidity needed for Bitcoin price to break through major resistance levels.
Current blockchain data shows that the market continues absorbing available supply. Whales continue accumulating Bitcoin. Long term holders continue holding their coins. Exchange reserves remain near multi year lows.
Institutional buying has not returned consistently. Until ETF inflows become sustained instead of temporary, the final confirmation that many analysts look for remains absent.
Bitcoin Price Recovery Still Looks Possible
BTC price has continued finding support near the upper part of the $50,000 range. Buyers have repeatedly defended the area between $57,000 and $59,000, which has prevented a deeper decline despite continued uncertainty.
Many analysts still believe Bitcoin could move lower before beginning its next major recovery. That view remains popular because institutional demand has not fully returned and broader market confidence remains fragile.
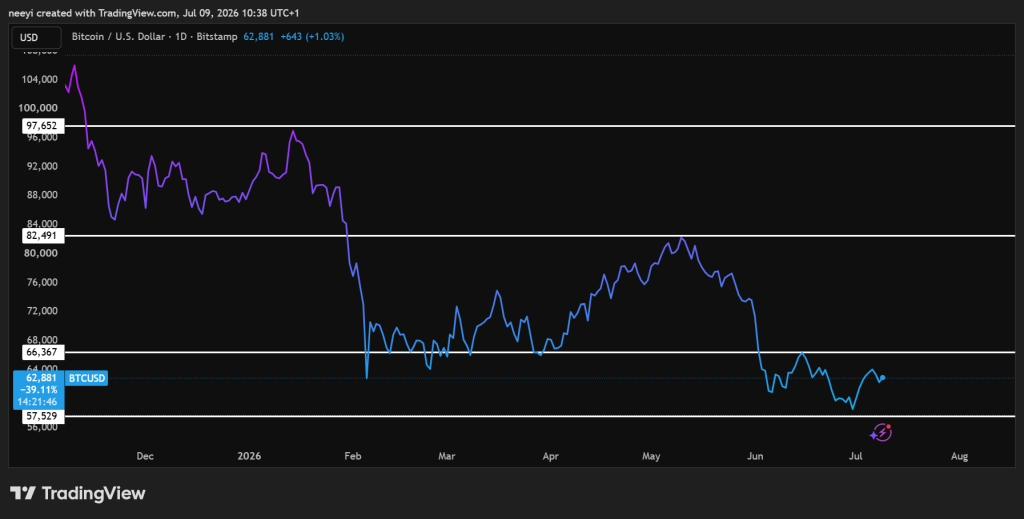
Recovery also remains a realistic possibility if Bitcoin clears several important resistance levels.
Strong resistance currently sits between $64,000 and $66,000. A successful move above that range could allow BTC price to return to the broader trading zone between $64,000 and $82,000, where Bitcoin traded for an extended period previously.
Another move above the $83,000 level could open the path toward Bitcoin’s 2026 high near $97,000 if buying pressure continues strengthening.
Downside risks still deserve attention. Support around $57,000 remains one of the most important levels on the Bitcoin chart. A decisive break below that area could send BTC price toward the $40,000 range before the market finally establishes a lasting bottom.
Read Also: How Much XRP Tokens Do You Need to Become Rich?
Bitcoin Price Still Needs One Final Confirmation
Bitcoin currently presents an interesting mix of encouraging signals and lingering uncertainty. On chain data closely resembles previous market bottoms, and several historical indicators continue supporting the case that sellers have become exhausted.
ETF demand remains the biggest missing ingredient. Consistent institutional buying could provide the catalyst needed for BTC price to escape its current range and begin a stronger recovery. Until that happens, Bitcoin remains in a position where the evidence points toward a bottom, but full confirmation still has to arrive.
FAQs
Subscribe to our YouTube channel for daily crypto updates, market insights, and expert analysis.






