XRP price remains under pressure after the latest market-wide decline, but EGRAG Crypto argues that the long-term bullish structure is still intact.
His latest monthly chart focuses on one level above all others: $1.20.
EGRAG believes the XRP price can retrace toward that area and still remain inside its macro bullish structure. A sustained monthly breakdown below it, however, would force him to rethink the entire thesis.
For now, he remains convinced that the major bottom is already behind XRP.
What you'll learn 👉
XRP Price: Why $1.20 Is EGRAG’s Main Line in the Sand
The chart places XRP inside a broad macro range, with $1.20 marked near the lower boundary of the current structure.
That level is important for several reasons.
First, XRP is still trading above the long-term 111 EMA, shown in blue. That moving average has acted as a major cycle reference on EGRAG’s chart during previous market phases.
Second, price remains close to the 33 EMA, shown in green. EGRAG treats this shorter long-term average as an important resistance and support marker during major cycle transitions.
The current structure is therefore compressed between long-term support underneath and resistance above.
EGRAG’s idea is that XRP can continue building this base without damaging the larger bullish picture, provided monthly candles do not establish themselves below $1.20.
If that level fails on a sustained basis, the current structure would no longer look like a normal macro correction.
XRP Chart Analysis
The most interesting part of EGRAG’s chart is how XRP interacted with the same moving averages during previous cycles.
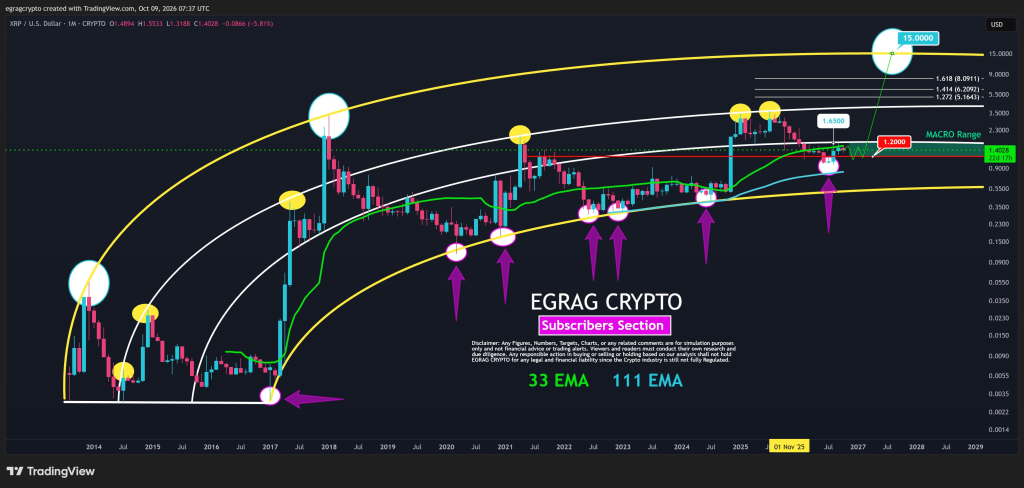
The chart goes back more than a decade and marks several major turning points with circles.
During earlier periods, deep corrections toward the lower long-term moving average were followed by powerful expansions.
The 2017 cycle is the clearest example.
XRP spent an extended period compressed near long-term support before eventually accelerating into a major rally.
A similar structure developed again in later cycles, with the 111 EMA acting as a broad support reference and the 33 EMA playing an important role during recoveries.
EGRAG is arguing that the current market is again building around these long-term averages.
That does not mean history has to repeat.
But it explains why he is treating the current decline as structure-building rather than a complete failure of the bullish thesis.
Read also: ChatGPT Predicts How Bitcoin, Ethereum, And XRP React To Another Rate Hike
$1.65 Is the First Major Reclaim
Before traders start thinking about $4, $8 or $15, XRP has a much closer level to deal with.
EGRAG marks $1.65 as the first major reclaim.
That level is important because it would move the XRP price back above the current macro range and improve the short-term structure significantly.
The chart then places several higher Fibonacci extension levels above it.
These include approximately:
| XRP level | Role in EGRAG’s chart |
|---|---|
| $1.20 | Main macro support and invalidation area |
| $1.65 | First major reclaim |
| $5.16 | 1.272 Fibonacci extension |
| $6.21 | 1.414 Fibonacci extension |
| $8.09 | 1.618 Fibonacci extension |
| $15+ | Long-term “Valhalla” scenario |
The $5.16 to $8.09 area is therefore not one single target.
It is a wider Fibonacci expansion zone that would only become relevant if XRP first recovers from the current range and pushes decisively above $1.65.
Why the $15 Target Is Far More Speculative
The most aggressive part of EGRAG’s chart is the projection toward $15.
The upper yellow curve on the chart represents a much larger long-term channel, and EGRAG maps a potential move toward that region after XRP clears the current macro range.
Technically, the chart provides a path.
Fundamentally, however, $15 is a very different proposition from $1.65.
At a price of $15, XRP would carry a market value approaching the trillion-dollar range depending on circulating supply at the time.
That would need far stronger capital inflows, much broader crypto participation, and continued institutional demand.
So the chart is most useful when viewed in stages.
The immediate question is whether $1.20 holds.
The next question is whether XRP can reclaim $1.65.
Only after those two conditions are met do the higher Fibonacci targets become much more relevant.
XRP Price Outlook
EGRAG’s chart is bullish over the long term, but it also gives traders a very clear invalidation point.
As long as XRP remains above $1.20 on a monthly basis, he treats the current decline as part of a larger bullish structure.
A recovery through $1.65 would strengthen that thesis and reopen the path toward the $5 to $8 Fibonacci zone.
A sustained monthly break below $1.20 would be a much more serious development.
That is why, despite the attention around the $15 target, the most important number on this chart is not $15.
It is $1.20.
For more crypto news and price predictions, click here.
Subscribe to our YouTube channel for daily crypto updates, market insights, and expert analysis.