
Gold is trying to stabilize near $4,180 after a difficult stretch that pushed the metal down from the late-August highs near $4,680.
At the same time, The Macro Paper is pointing to a much bigger driver that could become important over the coming weeks: the U.S. 10-year Treasury yield.
The account argues that the gold price has historically performed well after major peaks in the 10-year yield, and believes the current yield cycle may be approaching another turning point.
What you'll learn 👉
Why Falling Bond Yields Could Help Gold
The Macro Paper compared several previous periods when major turning points in Treasury yields lined up with large moves in gold.
Its examples included:
- 2007, when the 10-year yield peaked before a major gold advance
- 2018, when another yield peak came before a strong gold rally
- 2023, when falling yields again coincided with a large move higher in gold
The opposite pattern also appeared during periods when yields began rising from major lows.
The logic is straightforward.
THIS IS QUITE INTERESTING. Gold’s next rally could start sooner than expected. And the reason is US 10Y yield. Historically, Gold and the US 10Y yield have traded inversely to each other. – 2007: US 10Y yield peaked, and then Gold rallied 200%. – 2018: US 10Y yield peaked, and then Gold rallied 80%. – 2023: US 10Y yield peaked, and then Gold rallied 210%. And during the US 10Y yield uptrend, Gold has suffered drawdowns. – 2012: US 10Y yield bottomed, and then Gold dropped 30%. – 2020: US 10Y yield bottomed, and then Gold dropped 20%. – 2026: US 10Y yield bottomed, and then Gold dropped 30%. Now, with US bonds showing strong demand in auction, the yield could be close to peak. And if that happens, the stock market will start its downtrend while commodities will start their next rally.
— The Macro Paper (@macropaperr) October 9, 2026
When Treasury yields fall, the opportunity cost of holding gold becomes lower because bonds provide less income. Falling yields can also weaken the dollar and increase demand for non-yielding assets such as precious metals.
The Macro Paper believes stronger demand at recent Treasury auctions could be an early indication that yields are close to topping.
That is a longer-term thesis, though. For this weekend, the gold chart gives a much more immediate roadmap.
Read also: Gold and Silver Price Crash: Peter Schiff Says Traders Are Getting It Wrong
Gold Chart Shows Momentum Improving
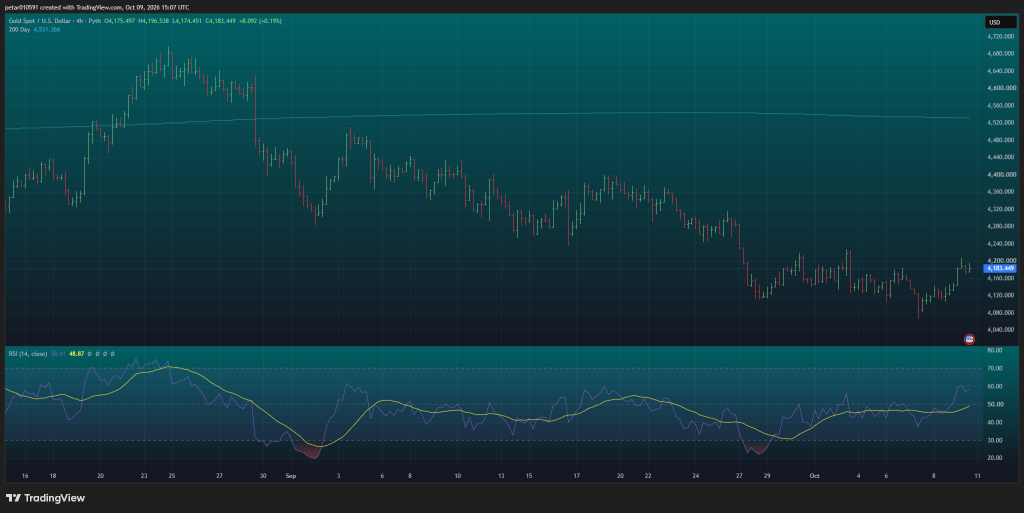
Gold is trading around $4,183 on the four-hour chart.
The first positive development is momentum.
RSI is near 58.4, above its signal average around 48.9. That is a clear improvement from the much weaker readings recorded during the late-September sell-off.
It also means gold is not overbought yet.
Price action has improved too.
After falling toward roughly $4,080, gold recovered and has started forming higher short-term lows. The latest move has brought price back toward the $4,180 to $4,200 resistance area.
That is now the first barrier bulls need to clear.
The larger trend is still weak, however. Gold remains well below the 200-day moving average near $4,530.
So the current recovery is still best treated as a rebound inside a broader corrective structure until higher resistance levels are reclaimed.
Key Gold Levels for October 10-11
| Level | Importance |
|---|---|
| $4,180-$4,200 | Immediate resistance |
| $4,240-$4,280 | Next upside target |
| $4,320 | Stronger resistance |
| $4,140-$4,150 | First support |
| $4,100-$4,120 | Important short-term support |
| $4,080 | Recent low |
| $4,000-$4,050 | Major downside zone |
Because gold trading is limited through most of Saturday and Sunday, these levels are most relevant into Friday’s close and when the market reopens Sunday evening.
Gold Price Prediction for This Weekend
| Scenario | What could happen | Price area |
|---|---|---|
| Bullish | Gold clears $4,200 and extends the rebound | $4,240-$4,280 |
| Neutral | Price consolidates after the recent recovery | $4,140-$4,200 |
| Bearish | Gold loses $4,140 and sellers return | $4,100-$4,120, then $4,080 |
The bullish case improves significantly if gold can close above $4,200.
That would open the door toward $4,240 and possibly $4,280.
The neutral case is probably the cleanest short-term scenario if yields remain stable. Gold could spend the next sessions moving between $4,140 and $4,200 before choosing a direction.
The bearish case returns if price loses $4,140. That would put $4,100 back in focus, followed by the recent low near $4,080.
For the longer term, The Macro Paper’s yield thesis is worth monitoring.
If the 10-year Treasury yield really is approaching a major peak, gold could eventually get a much stronger macro tailwind.
For this weekend, however, $4,200 is the main level bulls need to reclaim.
For more financial news and price predictions, click here.
Subscribe to our YouTube channel for daily crypto updates, market insights, and expert analysis.