
XRP price has stabilized after this week’s heavy sell-off and is trading around $1.40 at press time.
The token briefly dropped toward the low-$1.30 area earlier in the week before buyers stepped in. The latest two-hour chart now shows XRP attempting to recover, but price remains well below the $1.48-$1.50 region that acted as support before the decline.
The immediate question for October 10 is whether this recovery can develop into a larger rebound or whether the XRP price is simply pausing before another move lower.
What you'll learn 👉
XRP Price Momentum Is Improving
The first positive signal comes from RSI.
The chart shows:
| Indicator | Current reading |
|---|---|
| Short RSI | 61.58 |
| Medium RSI | 53.54 |
| Longer RSI | 46.99 |
| CCI | 109.13 |
Short-term RSI has moved above 60, indicating that buyers have regained some momentum after the recent oversold conditions.
The medium RSI has also recovered above 50, though the longer reading remains below that level. This points to improving short-term conditions without confirming a full trend reversal yet.
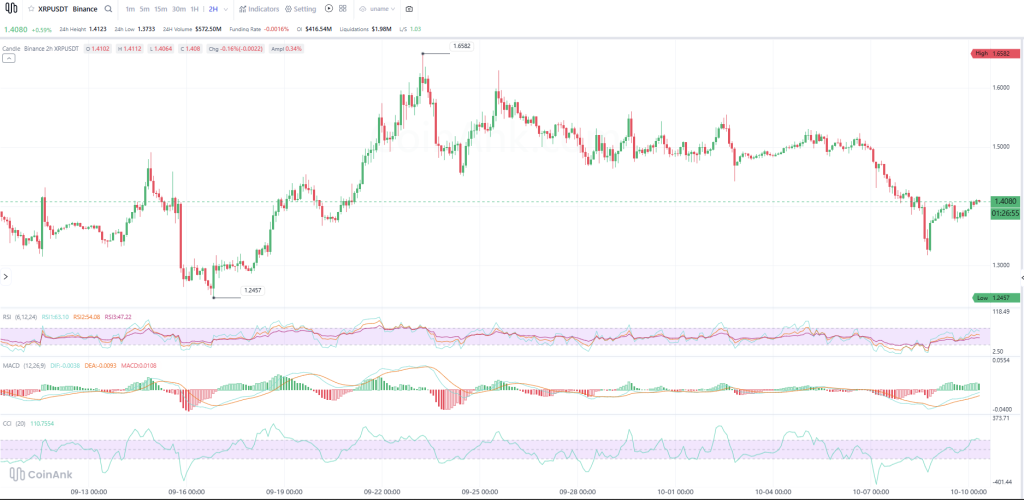
CCI has moved above 100, another indication that the rebound has developed meaningful momentum.
The risk is that XRP is already approaching its first resistance zone. If buyers cannot push through it, these indicators could cool quickly.
MACD Has Turned More Constructive
MACD has also improved considerably.
The histogram is positive, and the faster line has crossed above the signal line after the large bearish move earlier this week.
That supports the idea that selling momentum has weakened.
Still, both MACD lines remain close to the zero area, so this is more consistent with an early recovery than a confirmed bullish trend.
Price needs to reclaim higher resistance levels before the technical picture becomes substantially stronger.
XRP Support and Resistance Levels
XRP is currently trading close to $1.40-$1.41.
The first resistance is around $1.42. A clean move above that area could allow the XRP price to test $1.45.
The more important resistance remains around $1.48-$1.50, where price spent several days consolidating before the sell-off.
On the downside, $1.37-$1.38 is the first support.
Below that, $1.33-$1.35 becomes important again. The recent reaction from that area shows buyers are willing to defend it.
A loss of $1.33 could bring $1.30 into focus, followed by the September low around $1.25.
XRP Price Prediction for October 10
| Scenario | What could happen | Key XRP levels |
|---|---|---|
| Bullish | Recovery continues and XRP clears immediate resistance | $1.42, then $1.45-$1.48 |
| Neutral | XRP consolidates after the rebound | $1.37-$1.42 |
| Bearish | Recovery fails and sellers return | $1.33-$1.35, then $1.30 |
The bullish scenario becomes stronger if XRP can break above $1.42 and hold it. That could extend the recovery toward $1.45, with $1.48 becoming the more difficult test.
The neutral scenario would keep XRP between approximately $1.37 and $1.42 as traders wait for the broader crypto market to choose a direction.
The bearish scenario starts to develop if XRP falls back below $1.37. That would put $1.33-$1.35 back in focus, and another loss of that zone could expose $1.30.
For October 10, $1.42 is the key upside level.
Momentum indicators have improved noticeably, but XRP still needs to convert this rebound into a higher high before the short-term structure can turn convincingly bullish.
For more crypto news and price predictions, click here.
Subscribe to our YouTube channel for daily crypto updates, market insights, and expert analysis.