
In our last Bitcoin and Ethereum weekly prediction, we said the BTC price could hold 82,000–83,000 and move toward $88,000 if buyers defended that zone. BTC did break higher, reaching above $87,000 before pulling back to around $84,572.
For Ethereum, we said the ETH price needed to clear $2,650–$2,700 to open the door toward $2,800. ETH broke through that zone and reached close to $2,800 before settling around $2,709.
Both assets have therefore followed the bullish scenarios from last week, although neither has cleared its next major resistance. With Bitcoin entering the final days of a 43.5% Q3 advance and Ethereum posting a record 71.02% Q3 gain, the next price moves could be important.
What you'll learn 👉
What Is Pushing Bitcoin and Ethereum Prices?
Bitcoin enters the week with strong ETF demand behind it. U.S. spot Bitcoin ETFs recorded about $2.4 billion in net inflows for the week ending September 25, the largest weekly inflow since October 2025.
The funds also turned positive on a year-to-date basis, with cumulative net assets reaching about $108.4 billion. That demand came alongside BTC trading near $84,572, giving the Bitcoin price a sizeable institutional flow supporting the latest recovery.
The Bitcoin price also enters the final days of Q3 after gaining 43.5% during the quarter, its second-best third-quarter performance on record. Ethereum performed even better, gaining 71.02% for its strongest Q3 on record.
The figures were supported by ETF demand, higher spot activity and restrained profit-taking. Bitcoin also held through the September 25 quarterly options expiry, with the next major on-chain resistance identified near $96,700.
Ethereum has its own institutional catalyst. U.S. spot Ether ETFs added about $689.9 million during the week ending September 25, reversing roughly $140 million of outflows from the prior week. Ethereum ETF net assets reached about $17.8 billion. That gives the Ethereum price a fresh source of demand as ETH trades above $2,700.
There are also mixed fundamental factors to watch. Michael Saylor has called for U.S. banks to custody Bitcoin and provide loans backed by BTC, a proposal that could expand institutional access if regulators accept it.
Ethereum also faces an ecosystem-related negative after the $387.5 million Bitget breach, with stolen assets moved through Ethereum and THORChain. On the positive side, Vitalik Buterin demonstrated a pruned Geth node using 461 GiB of storage, making local Ethereum node operation more accessible on modern hardware.
Here’s What the Bitcoin Chart Is Showing
We had a look at the chart, and the key level remains $82,000–$83,000. BTC broke above this area during the September rally and pushed toward $87,000 before sellers brought the Bitcoin price back toward $84,500.
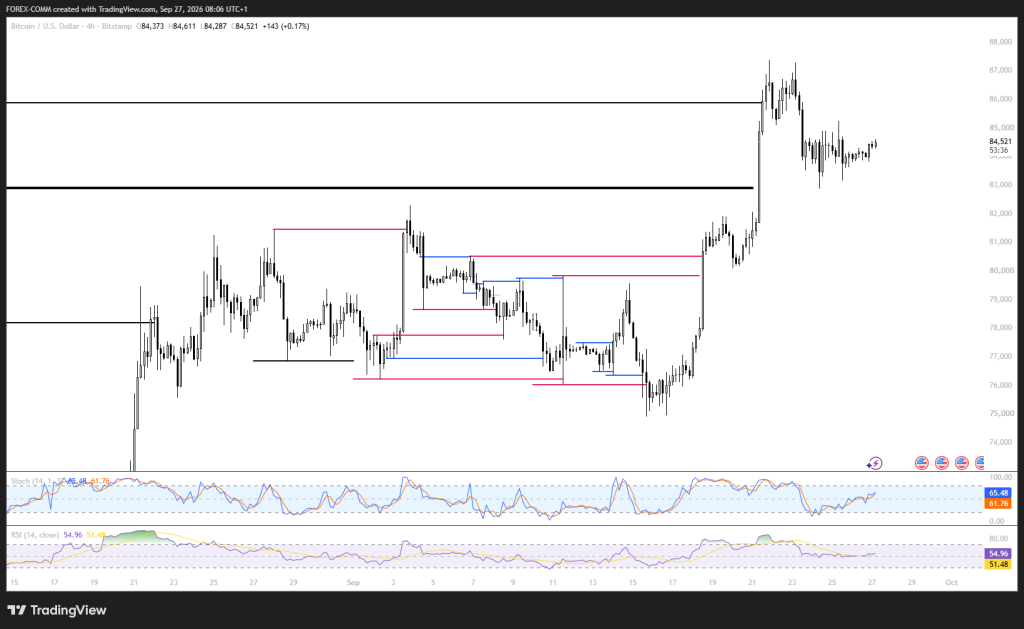
The marked $82,800 area now acts as the main support zone. As long as that region holds, the chart keeps a higher-price structure after the move from roughly $75,500 to above $87,000.
Above the market, $86,000 is the first resistance area visible on the chart, followed by the $87,000–$88,000 region where the latest rally stalled. A break above $88,000 would put the $90,000 psychological level into view.
The chart’s RSI is 54.96, with its average at 51.48, keeping momentum above the midpoint without reaching overbought territory. Stochastic readings of 65.48 and 61.76 also leave room for another move higher.
If the BTC price loses $82,800, the next areas to monitor are $80,000 and 77,000–78,000. That would bring the Bitcoin price back into the previous consolidation structure. For now, the chart shows consolidation above broken resistance rather than a confirmed bearish reversal.
Related Bitcoin News: Claude AI Predicts Where Bitcoin Price Could Be After the Bond Market Meltdown
Here’s What the Ethereum Chart Is Showing
The Ethereum chart has a similar structure, but ETH is trading directly around the $2,700 threshold. The Ethereum price climbed from roughly $2,380 in mid-September to almost $2,800 before pulling back toward $2,650 and recovering to $2,708.
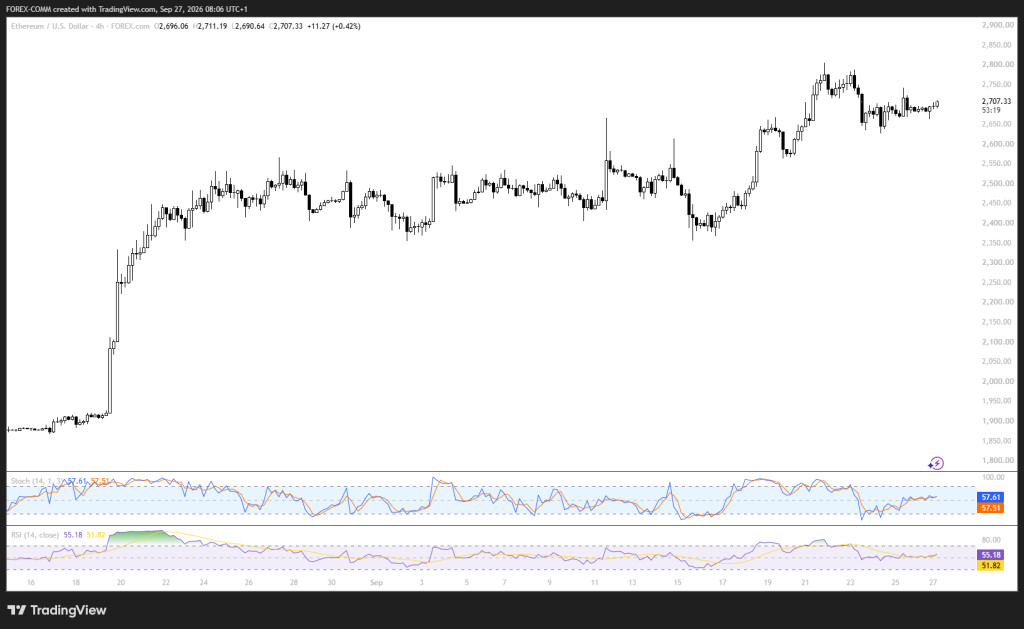
The $2,650–$2,700 region is therefore the first area to watch, since holding it keeps the latest breakout structure intact.
The next resistance is around $2,750, followed by the recent high near $2,800. A clean break above $2,800 could open $2,850 and potentially $3,000. Momentum indicators are not stretched: RSI stands at 55.18 versus 51.82 for its average, and stochastic readings are 57.61 and 57.51. That leaves the Ethereum price with room to move in either direction.
A move below $2,650 would weaken the setup and put $2,600 into view. Below that, $2,500 becomes the major support area from the earlier consolidation. A deeper breakdown could expose $2,400–$2,390, matching the support zone from the previous weekly prediction.
Where Will Bitcoin and Ethereum Prices Go This Week?
For Bitcoin, the first price path is bullish: holding $82,000–$83,000, breaking $86,000 and retesting $87,000–$88,000. A break through $88,000 would put $90,000 on the chart, with $96,700 as a larger resistance area.
The second path is consolidation, with the Bitcoin price moving between $82,000 and $86,000 as the market absorbs the latest rally. The third path is bearish: losing $82,000 could send BTC toward $80,000 and then $77,500–$78,000.
For ETH, the bullish path requires the Ethereum price to hold $2,650–$2,700 and clear $2,800, opening $2,850 and potentially $3,000. The second path is range trading between $2,600 and $2,800.
The bearish path begins below $2,600, exposing $2,500 and then $2,400–$2,390. With BTC ETF inflows of $2.4 billion and ETH ETF inflows of $689.9 million last week, the next test is whether that demand can keep prices above their key chart levels.
Frequently Asked Questions
Subscribe to our YouTube channel for daily crypto updates, market insights, and expert analysis.