Bitcoin price and Ethereum price enter the new week after recovering from a volatile mid-September period.
Bitcoin has extended its recovery toward $85,000, breaking above several important resistance levels following its recent rally. Ethereum has also recovered, with the latest supplied chart placing ETH around $2,640. The broader market rebound has improved sentiment, although Bitcoin’s correlation with technology stocks remains a factor worth monitoring.
The question now is whether the rally can extend or whether resistance around $85,000-$85,500 sends the Bitcoin price lower again.
What you'll learn 👉
What Drove Bitcoin and Ethereum Higher Last Week?
Crypto prices went up even though the dollar was strong.
Here’s what happened. On September 16, the Federal Reserve raised interest rates by 25 basis points to 3.75%-4.00%. This was the first rate hike since 2023. Most people expected it, so markets didn’t panic. The BTC price started around $76,000 and climbed to about $81,000 by the end of the week.
The dollar got stronger too. The DXY index went from 99.39 on September 14 to 100.25 on September 16. By September 18, it closed at 100.22. It dipped a tiny bit on Friday, but overall the dollar rose that week, hitting 100.56 at one point.
So crypto went up even with a strong dollar. The rally wasn’t because the dollar got weaker. It happened anyway.
Regulatory developments also gave the market another source of support. On September 17, the SEC approved a temporary five-year exemption allowing certain venues to trade tokenized U.S. stocks onchain under specified conditions.
The move came two days after the CLARITY Act failed to advance in the Senate by a 49-50 vote, giving crypto markets a regulatory development to focus on despite the legislative setback.
ETF flows added to the recovery. U.S. spot Bitcoin ETFs recorded about $159.5 million of net inflows on September 17 after heavy outflows earlier in the week, and another source reported roughly $433 million flowing into Bitcoin ETFs on September 18. Ethereum ETFs also recorded inflows on September 18, with one dataset putting the figure near $144 million.
News That Could Move Bitcoin and Ethereum This Week
Fed officials are going to be in the spotlight. Goolsbee, Williams, Jefferson and Barkin are all speaking, and traders want to know what they think about rates going forward. Why does this matter for Bitcoin? The Fed already pushed rates up to 3.75%-4.00%. If people start betting on another hike later in 2026, Treasury yields and the dollar could move, and that pulls on Bitcoin’s price.
ETF money is the other big thing to watch. Bitcoin ETFs had a choppy week. If money starts flowing back in, Bitcoin has a better shot at holding $80,000. If people pull money out, that level could crack. Ethereum ETFs matter too, especially around $2,500. ETH bounced back from $2,390, so now everyone wants to see if that recovery sticks.
One more thing hanging over the market: the CLARITY Act vote failed. The Senate needed 60 votes to move it forward. They got 49 yes and 50 no. So the bill is stuck for now.
Here’s What the Bitcoin Chart Is Showing
Bitcoin has staged an impressive recovery from the $75,000–$76,000 region, climbing toward $85,000. The latest supplied weekly chart places BTC near $84,630, above its 50-week moving average and the previous resistance zone around $82,000–$83,000. The next major upside target is $88,000, although a retest of the breakout area remains possible.
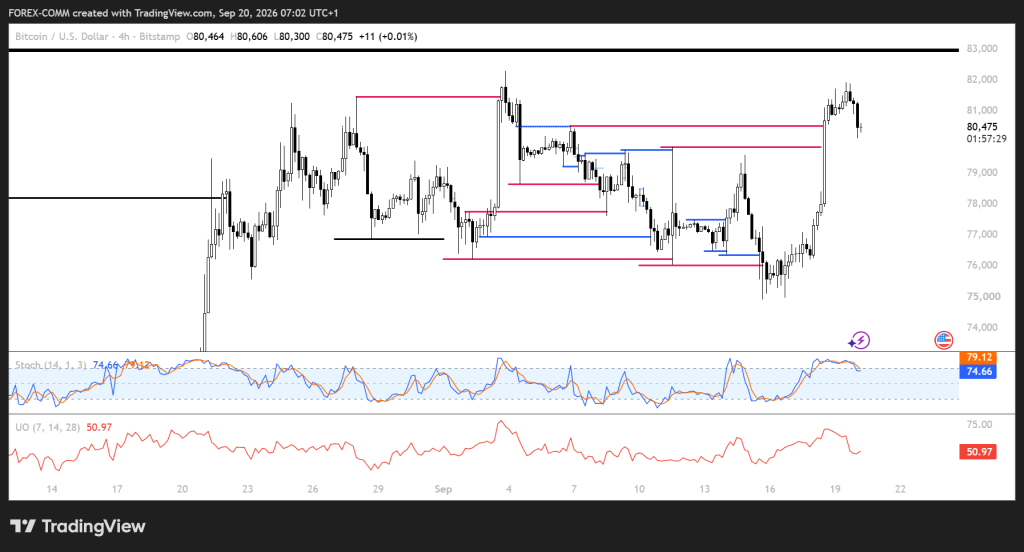
The marked resistance zones are around $85,300-$85,500 and $87,000, with $88,000 standing as the larger upside level on the chart.
Momentum has cooled after the move higher. Bitcoin’s Stochastic reads 74.66 for %K and 79.12 for %D, placing the indicator near the upper part of its range.
The Ultimate Oscillator is 50.97, giving a more neutral reading. If the BTC price holds above $80,000, another test of $81,500 and $82,000 becomes possible; losing $79,000 could bring $78,000 and $76,000 back into play.
Related Ethereum News: Ethereum Price News: ETH Breaks January High as Whales Wake Up
Here’s What the Ethereum Chart Is Showing
Ethereum has recovered from its earlier consolidation and climbed above $2,600, with the latest supplied chart showing ETH around $2,640. The move puts the $2,650–$2,700 resistance region back in focus, while the $2,500–$2,550 area remains an important zone to monitor during a pullback.
The latest move has taken the Ethereum price above the $2,500 region that contained much of its earlier September trading range. Resistance is now concentrated around $2,600-$2,650, followed by the $2,700 area.
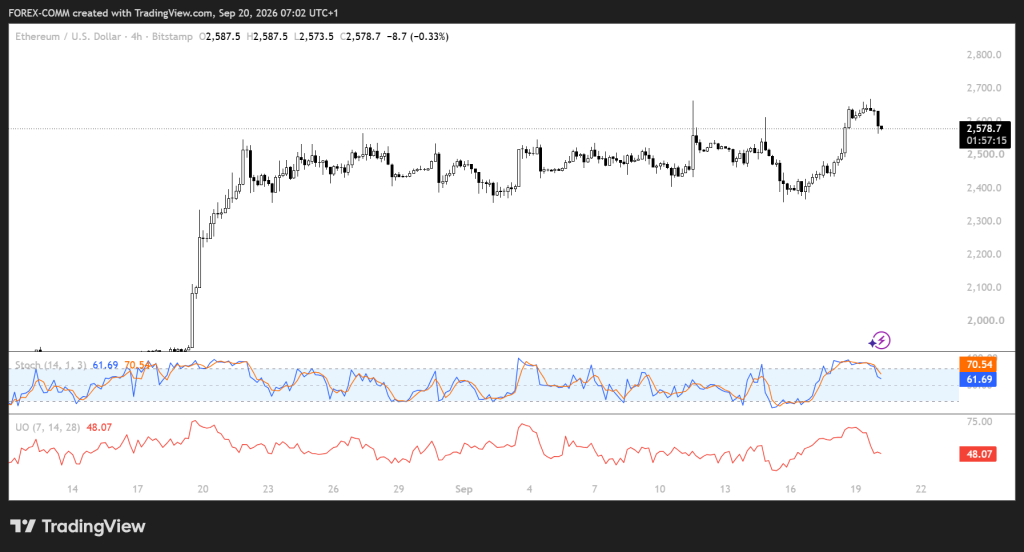
The indicators show less extreme momentum than Bitcoin. Ethereum’s Stochastic stands at 61.69 for %K and 70.54 for %D, showing that buyers still have an advantage, but momentum has cooled from its recent peak.
The Ultimate Oscillator is 48.07, close to neutral. Holding $2,500 could keep the Ethereum price aimed at $2,700 and $2,750, whereas a break below $2,400 would expose the $2,350-$2,390 region.
Where Will Bitcoin and Ethereum Prices Go This Week?
For Bitcoin, the bullish scenario depends on holding above the recently broken $82,000–$83,000 resistance zone. With BTC trading around $85,000, a sustained move higher could open the way toward $88,000, followed by the psychological $90,000 level. The base scenario involves consolidation between $82,000 and $86,000 as traders assess the strength of the latest rally.
The bearish scenario begins if Bitcoin falls back below $82,000. Such a move could trigger a retest of $79,000–$80,000, where the 50-week moving average and previous resistance are located. A sustained breakdown below $79,000 would put $77,500–$78,000 back in focus.
For the Ethereum price , the bullish scenario requires a sustained break above $2,650–$2,700, potentially opening the way toward $2,800. The base scenario keeps ETH trading between $2,500 and $2,700 as the market consolidates following its recovery.
The bearish scenario begins below $2,500, which could expose $2,400–$2,390 as the next support region.
Overall, Bitcoin’s ability to defend $82,000–$83,000 and Ethereum’s ability to overcome $2,700 will be important tests of whether the latest crypto market recovery can continue.
These scenarios use the latest prices and charts supplied in our discussion, not independently verified live quotes.
Frequently Asked Questions
Subscribe to our YouTube channel for daily crypto updates, market insights, and expert analysis.