Ethereum has climbed back above the midpoint of its recent price range. XRP has returned to a level it lost earlier this week, and Cardano is testing whether a sudden jump can hold.
Each coin has a different setup for September 18, but the question is similar: can buyers defend the ground they have just recovered?
What you'll learn 👉
Ethereum Price Moves Toward the Top of Its Recent Range
Ethereum price trades near $2,482 after rebounding from the lower end of a range that has held since around mid August. ETH has spent much of that period between $2,350 and $2,550. Moves toward $2,350 have led to rebounds, and moves toward $2,550 have met resistance.
The latest rebound began about 3 days ago. Ethereum has since moved above $2,440, the approximate midpoint of the range. That puts $2,550 back in view if ETH remains above the midpoint. A fall below $2,440 would weaken that near term outlook, although the price would still be inside its broader range.
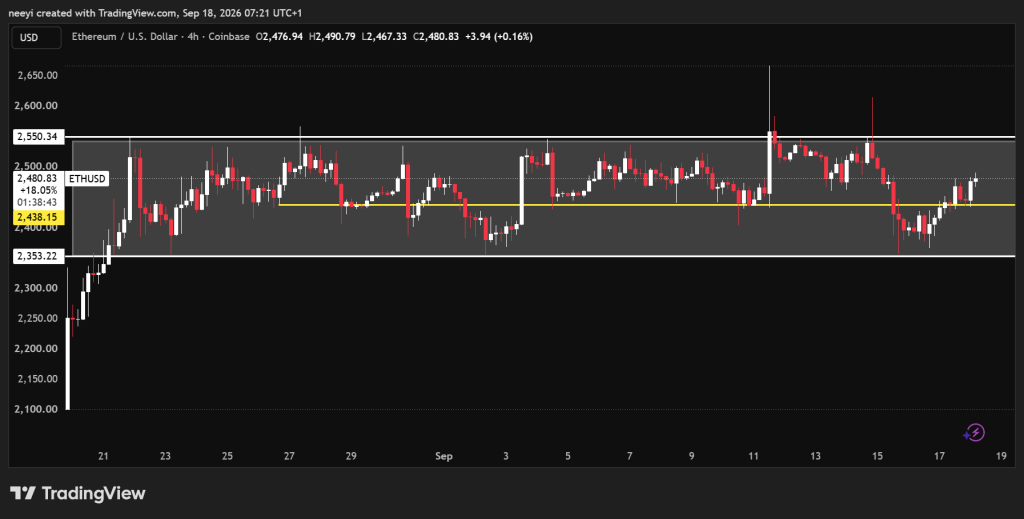
The indicators give a mixed reading. Ethereum’s RSI of 54.057 shows modest strength without pointing to an extreme move. Its MACD remains negative at -3.06, so that indicator has not confirmed the recovery. The Ultimate Oscillator reads 60.675, which supports the upward move, and Bull/Bear Power at 51.688 shows buyers currently have the advantage.
| Indicator | Value | What the Reading Means |
|---|---|---|
| RSI(14) | 54.057 | Modest strength leaves room for either direction. |
| MACD(12,26) | -3.06 | Negative momentum has not fully recovered. |
| Ultimate Oscillator | 60.675 | The reading supports continued upward pressure. |
| Bull/Bear Power(13) | 51.688 | Buyers currently have the stronger position. |
Ethereum Price Prediction for Today: Bullish, Neutral, and Bearish Scenarios
- A bullish day would see Ethereum hold above $2,440 and continue toward $2,550.
- A neutral day would keep ETH near $2,482 as it moves between the midpoint and the top of its range.
- A bearish move would take the price below $2,440 and put the lower part of the $2,350 to $2,550 range back in focus.
XRP Price Tests Former Support Near $1.32
XRP price is back near $1.32, but the level means something different now. XRP broke below that support 3 days ago, reached a temporary low near $1.24 the following day, and has since recovered. The return to $1.32 is a test of whether former support will now act as resistance.
If XRP cannot move above $1.32, the price could retreat toward $1.28 today. A break below $1.28 would bring the recent $1.24 low back into view. If XRP clears $1.32 instead, the next upside level in this setup is $1.37.
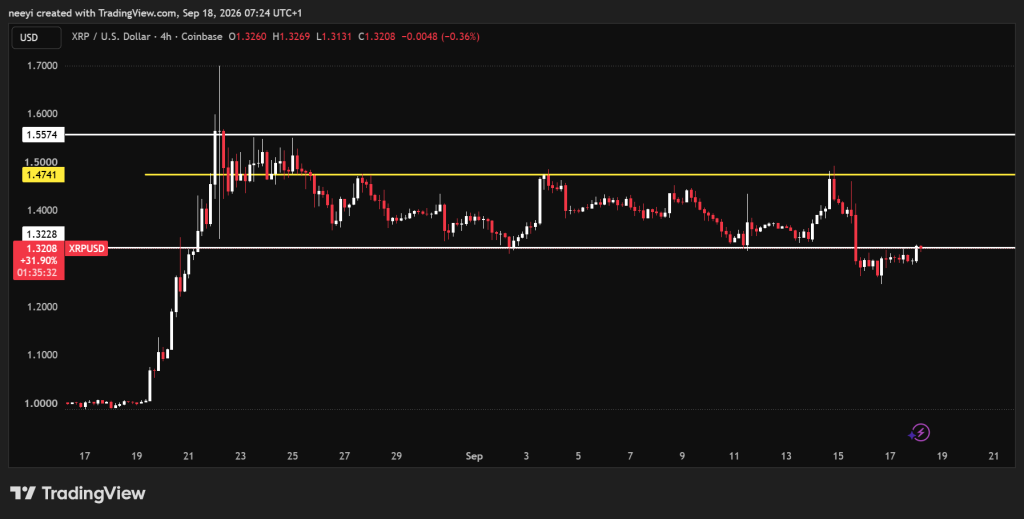
XRP’s indicators explain why the test remains open. RSI stands at 46.834, close enough to the middle of its range to offer little confirmation either way. MACD is negative at -0.016, which points to lingering weakness. The Ultimate Oscillator reads 52.708 and Bull/Bear Power is slightly positive at 0.0087. Those latter 2 readings favor buyers, though neither removes the need for XRP to reclaim $1.32.
| Indicator | Value | What the Reading Means |
|---|---|---|
| RSI(14) | 46.834 | Momentum remains close to the middle of its range. |
| MACD(12,26) | -0.016 | Negative momentum still weighs on the recovery. |
| Ultimate Oscillator | 52.708 | Buyers have some support for another attempt higher. |
| Bull/Bear Power(13) | 0.0087 | Buyer strength is positive, though limited. |
XRP Price Prediction for Today: Bullish, Neutral, and Bearish Scenarios
- A bullish outcome requires XRP to break above $1.32, which could open a move toward $1.37.
- A neutral outcome would keep the price near $1.32 as the resistance test continues.
- A bearish rejection could send XRP to $1.28, with $1.24 possible if that lower support fails.
Cardano Price Retests $0.213 After a Strong Four Hour Candle
Cardano price rose more than 6% during its latest 4 hour candle. ADA is now retesting resistance near $0.213, the level it broke during that move. The question is whether $0.213 can hold as support.
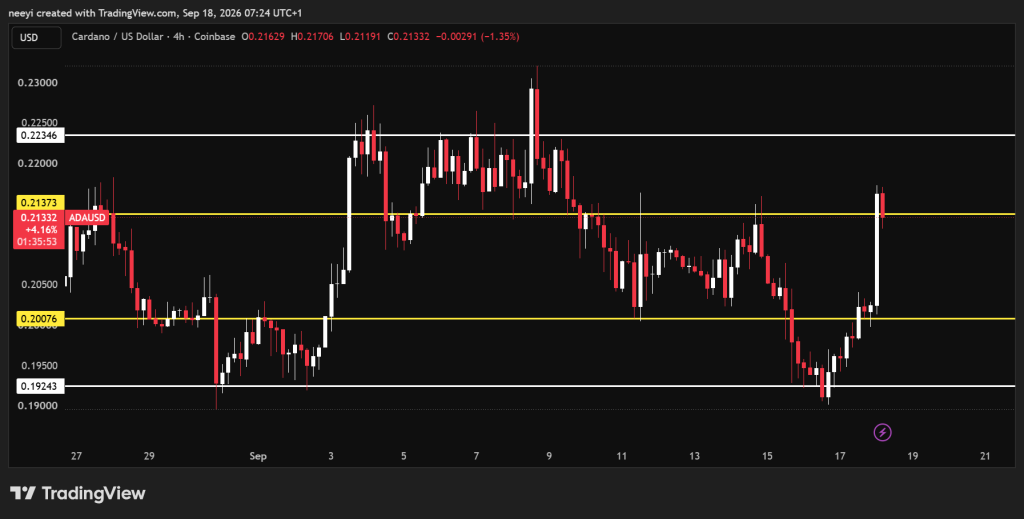
If it does, ADA could move toward $0.223 today. If the retest fails, a retracement could take Cardano price back toward $0.20. A break below $0.20 would put $0.19 in view by the end of the day. That makes $0.213 the first level to watch before either wider scenario comes into play.
Cardano’s indicators lean more positive than those of Ethereum and XRP. RSI at 59.717 shows stronger momentum without reaching an extreme reading. MACD is at 0, so it offers no clear directional confirmation yet. The Ultimate Oscillator stands at 65.916, and Bull/Bear Power reads 0.0214. Both support the recent move, though the price reaction at $0.213 will show whether ADA can keep that progress.
| Indicator | Value | What the Reading Means |
|---|---|---|
| RSI(14) | 59.717 | Momentum favors buyers without reaching an extreme. |
| MACD(12,26) | 0 | This indicator gives no clear direction yet. |
| Ultimate Oscillator | 65.916 | The reading supports the recent price increase. |
| Bull/Bear Power(13) | 0.0214 | Buyers retain an advantage after the large candle. |
Cardano Price Prediction for Today: Bullish, Neutral, and Bearish Scenarios
- A bullish day would see ADA defend $0.213 as support and test $0.223.
- A neutral day would keep Cardano price close to $0.213 as the market absorbs the 6% jump.
- A bearish day would take ADA below $0.213 and toward $0.20, with $0.19 possible if $0.20 breaks.
FAQs
Subscribe to our YouTube channel for daily crypto updates, market insights, and expert analysis.