
Bitcoin, XRP, and Cardano enter September with several important price levels close enough to decide how the first trading day of the month develops. The wider crypto market has also opened September on stronger footing, which gives the 3 assets an interesting backdrop as they test resistance levels that have remained intact since Friday.
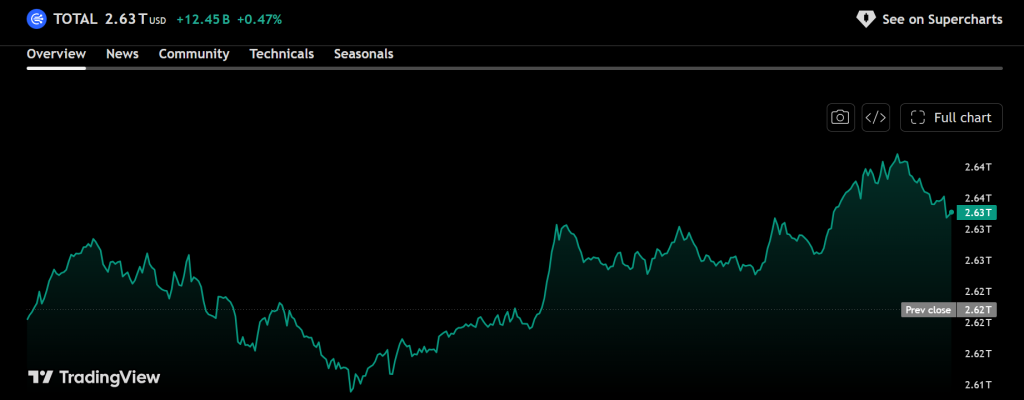
Total crypto market capitalization increased about 1.7% to $2.73 trillion on September 1. Expanded U.S. Treasury debt buyback operations have helped push longer-term yields and the dollar lower. Renewed spot ETF inflows have also provided support for major crypto assets.
Debate around minority chain proposals, including Luke Dashjr’s BLAKE2b fork proposal, remains part of the broader Bitcoin discussion. The main Bitcoin chain and major hardware wallet users remain unaffected, which keeps the immediate focus on price action and the key levels ahead.
Bitcoin price is currently pressing against the upper boundary of its recent range. XRP price is dealing with a similar setup, although its technical indicators are more divided. Cardano price is also testing resistance, which could make the next few hours important for ADA.
What you'll learn 👉
Bitcoin Price Nears $79,200 Resistance as Technical Indicators Favor Buyers
Bitcoin price has traded mostly sideways since Friday, with BTC moving between support around $77,300 and resistance near $79,200. That range remains the main area to watch on September 1 because Bitcoin is once again close to its upper boundary.
A break above $79,200 could give BTC enough room to test $81,000 before the end of the day. Failure to clear $79,200 could keep Bitcoin price inside the established $77,300 to $79,200 range.
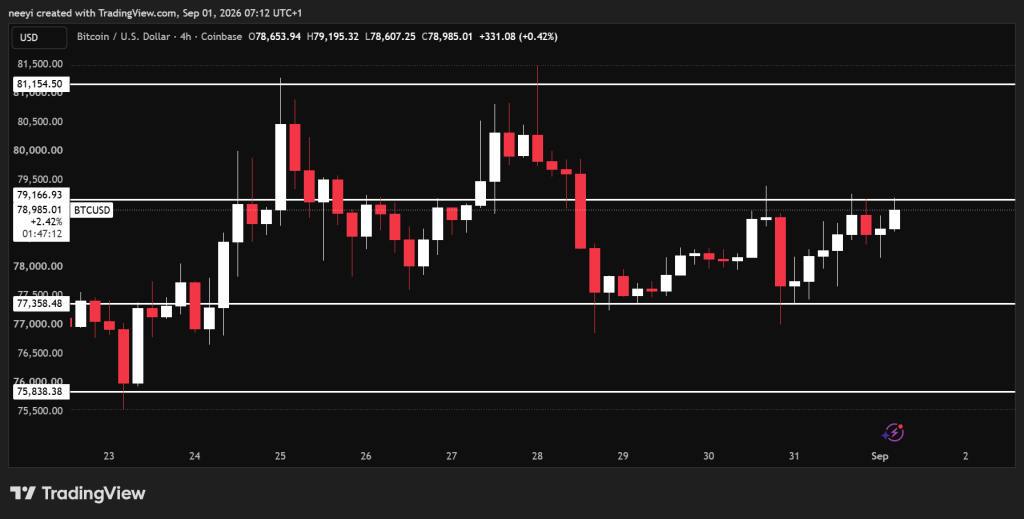
The downside scenario becomes more important if $77,300 fails. Bitcoin could then fall toward $75,800, which represents the next major level from the current setup.
Technical indicators from Investing.com’s 5 hour timeframe lean toward buyers. RSI stands at 57.686 and carries a buy reading, which places Bitcoin above the neutral midpoint without pushing the indicator into extreme territory.
MACD is also on buy at 148.1, and the Ultimate Oscillator gives another buy reading at 62.008. Bull/Bear Power completes the group with a buy reading of 140.4603.
The longer moving averages provide further context. Bitcoin remains well above both the MA100 and MA200 readings.
| Bitcoin Indicator | Simple MA | Signal | Exponential MA | Signal |
|---|---|---|---|---|
| MA100 | $72,041.2 | Buy | $73,814.1 | Buy |
| MA200 | $68,223.1 | Buy | $70,144.3 | Buy |
Those moving averages remain far below the current Bitcoin price range. The immediate question therefore comes down to $79,200 rather than those lower averages. BTC needs to clear that resistance before $81,000 becomes the next realistic target for September 1.
XRP Price Tests $1.42 as Technical Indicators Remain Divided
XRP price has followed a comparable range pattern since Friday, although its indicators provide a less convincing bullish picture than Bitcoin.
The main XRP trading range stretches from $1.35 to $1.42. XRP is currently challenging the upper portion of that area, which makes $1.42 the first important level for today’s price prediction.
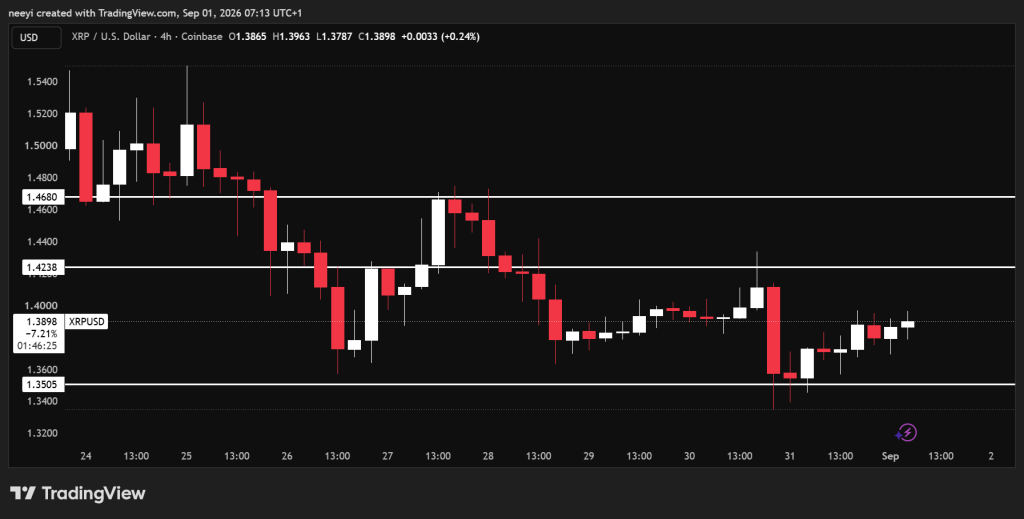
A clean move above $1.42 could open the path toward $1.46. Failure to clear that resistance could keep XRP trading between $1.35 and $1.42 for longer.
Downside pressure would become more important if XRP loses $1.35. Such a break could expose $1.29 before the end of September 1.
XRP’s indicators show a mixed picture. RSI stands at 50.333, which gives a neutral reading. MACD remains on sell at negative 0.014, and Bull/Bear Power also carries a sell reading at negative 0.0115. The Ultimate Oscillator provides the stronger reading at 57.718 with a buy signal.
The moving averages also show why $1.42 remains difficult.
| XRP Indicator | Simple MA | Signal | Exponential MA | Signal |
|---|---|---|---|---|
| MA50 | $1.4338 | Sell | $1.3628 | Buy |
| MA200 | $1.1594 | Buy | $1.2147 | Buy |
The simple MA50 at $1.4338 stands slightly above the $1.42 resistance. XRP could therefore encounter another technical barrier soon after clearing its current range.
The exponential MA50 at $1.3628 carries a buy reading and remains close to the lower portion of the current range. Both MA200 readings are considerably lower and remain on buy, which provides a stronger picture from the longer moving average perspective.
XRP price therefore has a straightforward test ahead. Buyers need to overcome $1.42 and then deal with the simple MA50 area before $1.46 becomes easier to reach.
Cardano Price Challenges $0.204 as ADA Faces Its Next Major Test
Cardano price is also close to the upper boundary of its recent range. ADA has traded mainly between $0.189 and $0.204, and price is once again pressing toward $0.204.
A successful break above $0.204 could give Cardano room to move toward $0.215 during September 1. Failure at that resistance could keep ADA trapped inside the same range.
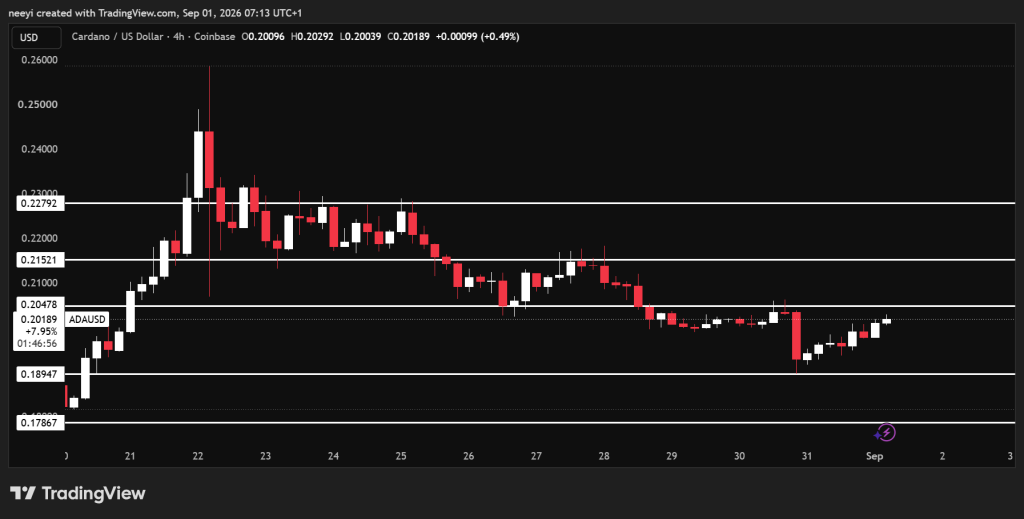
The bearish scenario depends heavily on $0.189. A break below that support could expose $0.178 before the end of the day.
Cardano’s technical indicators are divided. RSI stands at 49.376 with a neutral reading, which places ADA almost directly around the indicator’s midpoint. MACD remains on sell at negative 0.004.
The Ultimate Oscillator gives a buy reading at 55.617, and Bull/Bear Power also remains on buy at 0.0011. Those readings leave ADA without the same technical agreement currently visible across Bitcoin’s indicators.
Cardano’s moving averages provide another useful clue.
| Cardano Indicator | Simple MA | Signal | Exponential MA | Signal |
|---|---|---|---|---|
| MA50 | $0.2113 | Sell | $0.2030 | Sell |
| MA200 | $0.1884 | Buy | $0.1913 | Buy |
The exponential MA50 at $0.2030 is almost directly beside the $0.204 resistance level. The simple MA50 at $0.2113 also stands between the current range and the $0.215 upside target.
That setup means Cardano price may need to clear more than one nearby barrier before $0.215 becomes easier to reach.
The MA200 levels create an equally interesting picture below the current price. The simple MA200 stands at $0.1884 and the exponential MA200 comes in at $0.1913. Both are close to the $0.189 support area identified from recent price action.
Cardano therefore has technical reference points clustered around both sides of its current range. The MA50 readings reinforce the resistance area, and the MA200 readings provide context around the lower boundary.
FAQs
Subscribe to our YouTube channel for daily crypto updates, market insights, and expert analysis.